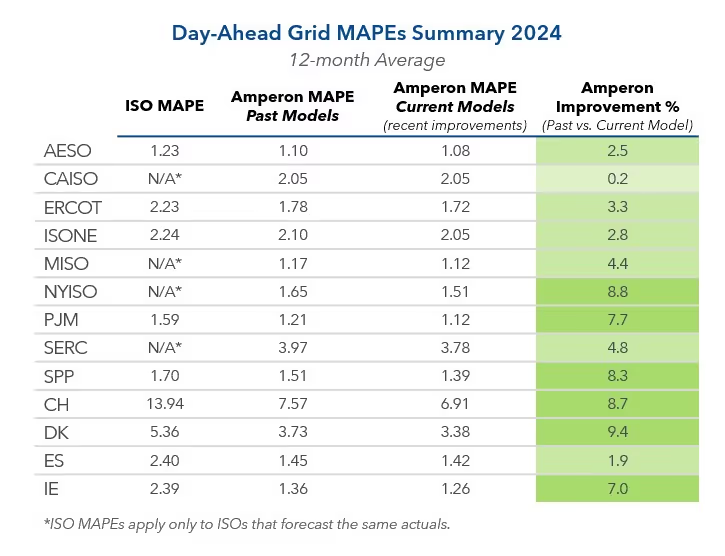
Most times of day, most places on the grid, Amperon offers the most accurate energy demand forecasts. We do especially well during extreme weather events. Below we highlighted an event for each U.S. ISO that showcases just that.
CAISO
February 3-6, 2024: Atmospheric River Event in Los Angeles
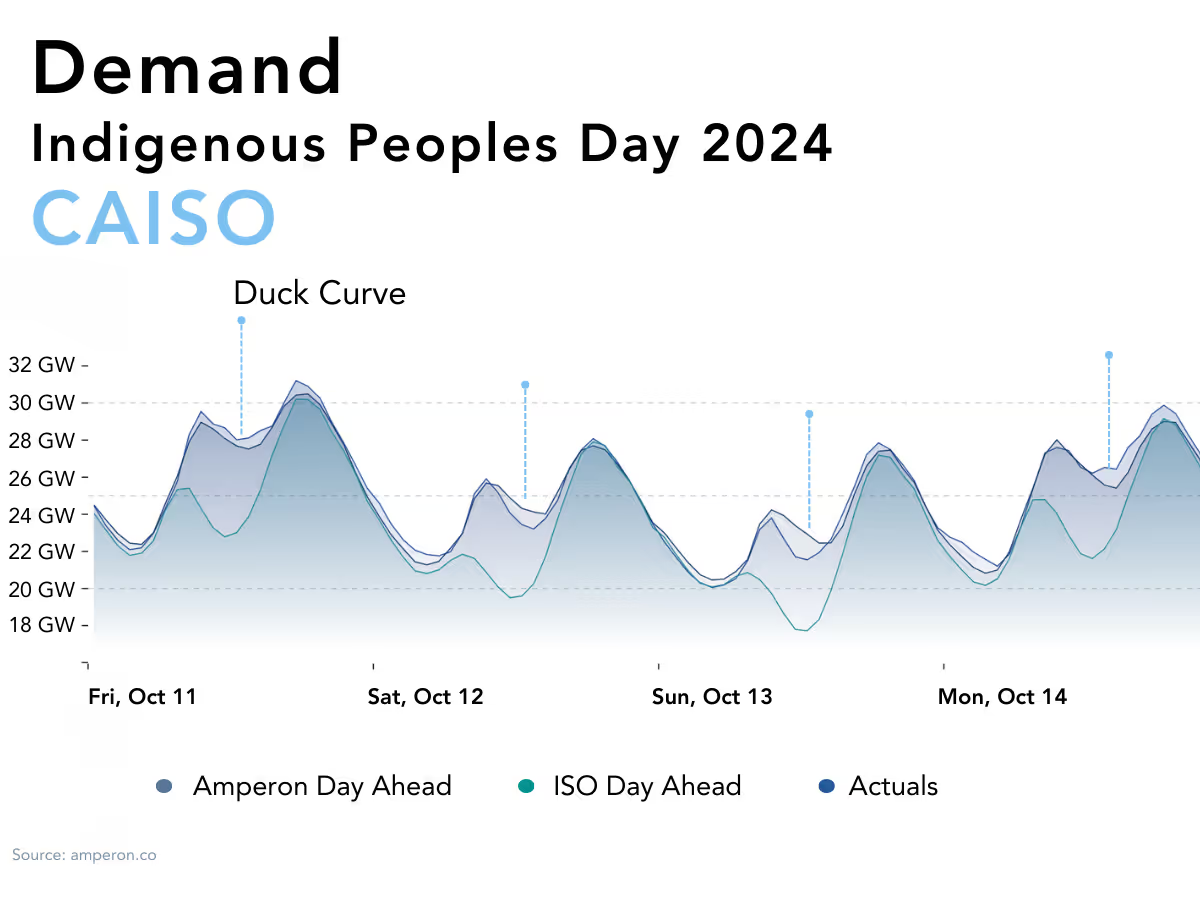
Certain regions of Southern California and more specifically, parts of LA, got up to 13 inches of rain during the beginning of February. This caused a major flooding event with minimal solar generation and an increase of lightening load. And CAISO’s morning peaks and midday demand forecast have been known to be consistently weak around HE8-HE16 times of day.
February 3rd at HE19:
- Amperon’s Absolute Percentage Error (APE): 0.20%
- The ISO’s APE was 1.57%
Amperon's Net Demand were more accurate than HE10-HE16 most days because of how weak CAISO DAM demand forecasts were.
Southern California Edison Highlight
Amperon’s peak forecast APEs consistently outperformed SCE for this period.
- February 2nd at HE19:
- Amperon’s APE: 2.15%
- The ISO’s APE was 4.07%
- February 5th saw a morning demand peak at HE13
- Amperon’s APE: 2.39%
- ISO’s APE was 10.79%

ERCOT
January 14-17, 2024: Winter Storm Heather
The Texas power grid hit multiple winter peak demand records during Winter Storm Heather which brought a frigid blast of arctic air to the Lone Star State. This included daily record lows of 17- and 19-degrees Fahrenheit, combined with wind chills that brought some parts of Northern Texas into the single digits.
January 15th
- All weather vendors had the cold front coming in later than expected
- Peak Load occurred at HE21 and was 76.3 GW
- Our Weather Actuals APE was 0.92%
- Using actual weather temperatures, we can isolate if this was a model error or weather miss.
January 16th
- Amperon’s MAPE was 1.84% and ERCOT’s MAPE was 4.07%
- Peak Load: Occurred at HE8 and was 78.1 GW. ERCOT saw the lowest temperatures at 15 ℉
- Amperon APE was 2.84% and ERCOT’s APE was 10.15%
- ERCOT over forecasted their demand during this volatile time
Prices
- DAM prices cleared between $1,630-$2,060 depending on the ERCOT Zone based on ERCOT’s 86.1GW DAM Peak load at HE8
- In real-time, prices settled $359-$546 at this hour between the zones, and the peak load was only 78.1 GW
By using Amperon’s forecasts, customers would have saved hundreds of dollars knowing that the load would not come close to the cleared peak load. Traders, specifically, would have known that the future price of power would not have reached anywhere close to what DAM cleared.

PJM
January 12-18, Winter Storm Gerri
Winter Storm Gerri swept through the Midwest in mid-January, bringing heavy snow and blizzards to the region along with bitter cold air to much of the Central U.S. The storm also caused rare blizzards in the Northwest and flooding in the coastal Northeast. This Arctic Blast brought a wide range of results across PJM’s vast area.
- January 17th Peak Load occurred at HE9
- Amperon APE was 1.93% and PJM’s was 2.33%
- PJM’s temperatures dropped to 9℉
COMED
- January 14th: Peak load hour was HE20
- There was a weather miss and the DA temperatures were much higher
- Amperon’s Weather Actual APE was 0.58%
- January 15th: At the peak load hour, HE19, Amperon’s APE was 0.04% and was 0.35% at HE10, the peak load in the morning
- On both days, temperatures were under 0 ℉ and dropped as low as -9 ℉
PENELEC
- On January 15th and 16th, PJM overshot both days as actual demand ended up weaker than PJM’s forecast.
- January 15th: Peak load hour was HE11 and the Amperon APE was 0.12%
- January 16th: Peak load hour was HE18 and the Amperon APE was 1.28%
Prices
- January 15th
- PENELEC DAM prices cleared $160.87 at HE11
- PENELEC RT prices settled at $136.25 at HE11
- January 16th HE18-PENELEC
- PENELEC DAM prices cleared at $193.57 at HE18
- PENELEC RT prices settled at $137.07 at HE18
This price difference, while not dramatic, makes a huge difference for this magnitude. Using Amperon’s forecasts would have saved money by recognizing PJM overshot their demand forecast for both the whole day and the peak. Additionally, energy was tight throughout the Arctic Blast and extra energy could have been sent elsewhere for a profit.
Overall, prices in RT were weaker than DA. If traders were selling energy in the RT, they would have lost money if they assumed DA demand would be stronger in RT (which was NOT the case).

MISO
January 14-17, 2024 Arctic Blast
The mid-January arctic blast brought consecutive days of subzero temperatures to the Midwest. Temperatures dropped under 10-degrees Fahrenheit on January 14th and stayed that way until the 17th.
- The Amperon forecast outperformed the MISO’s almost every day – especially the 14th and 15th when temperatures were close to 0 ℉
- January 15th at HE20 (peak demand of the day):
- Amperon APE was 0.94%
- MISO’s APE was 4.86%

SPP
January 13-17, 2024 Arctic Blast
In the Southwest Power Pool (SPP) during this arctic blast, temperatures dropped to single digits and under 0-degrees Fahrenheit on Sunday the 13th.
- Amperon’s forecast did well the first few days of this cold spell (13th and 14th)
- January 13th: Peak Load occurred at HE21 with Amperon’s APE 0.41%
- January 14th: Peak Load occurred at HE19 with Amperon’s APE of 2.32%
Weekends can be difficult to forecast since some trading clients forecast the weekend days in advance, but Amperon’s weekday and weekend forecasts perform well during volatile weather.

NYISO
January 15-23, 2024 Nor'easter Winter Storm
This large storm brought heavy snow, rain, and wind which combined with freezing temperatures brought on major disruptions. During this time, NYISO seemed to consistently underestimate their load forecasts.
- Almost every Amperon APE across this period is under 1%, dramatically better than the ISOs.
- January 17th: Peak Load occurred at HE19 with an Amperon APE of 0.24% and NYISO APE of 4.44% (temperatures in the teens)
- January 20th: Peak Load occurred at HE19 with an Amperon APE of 0.75% and a NYISO APE of 6.18% (temperatures in the teens)

We are the energy industry’s trusted forecasting and analytics partner, to request a demo, contact our team here.


.svg)



%20(3).png)
%20(2).png)
%20(1).png)



.png)


.avif)


.avif)

.avif)

.avif)

.avif)
%20(15).avif)
.avif)
%20(10).avif)

.avif)

.avif)
.avif)




.avif)






.avif)

.avif)





.avif)



.avif)
.avif)


