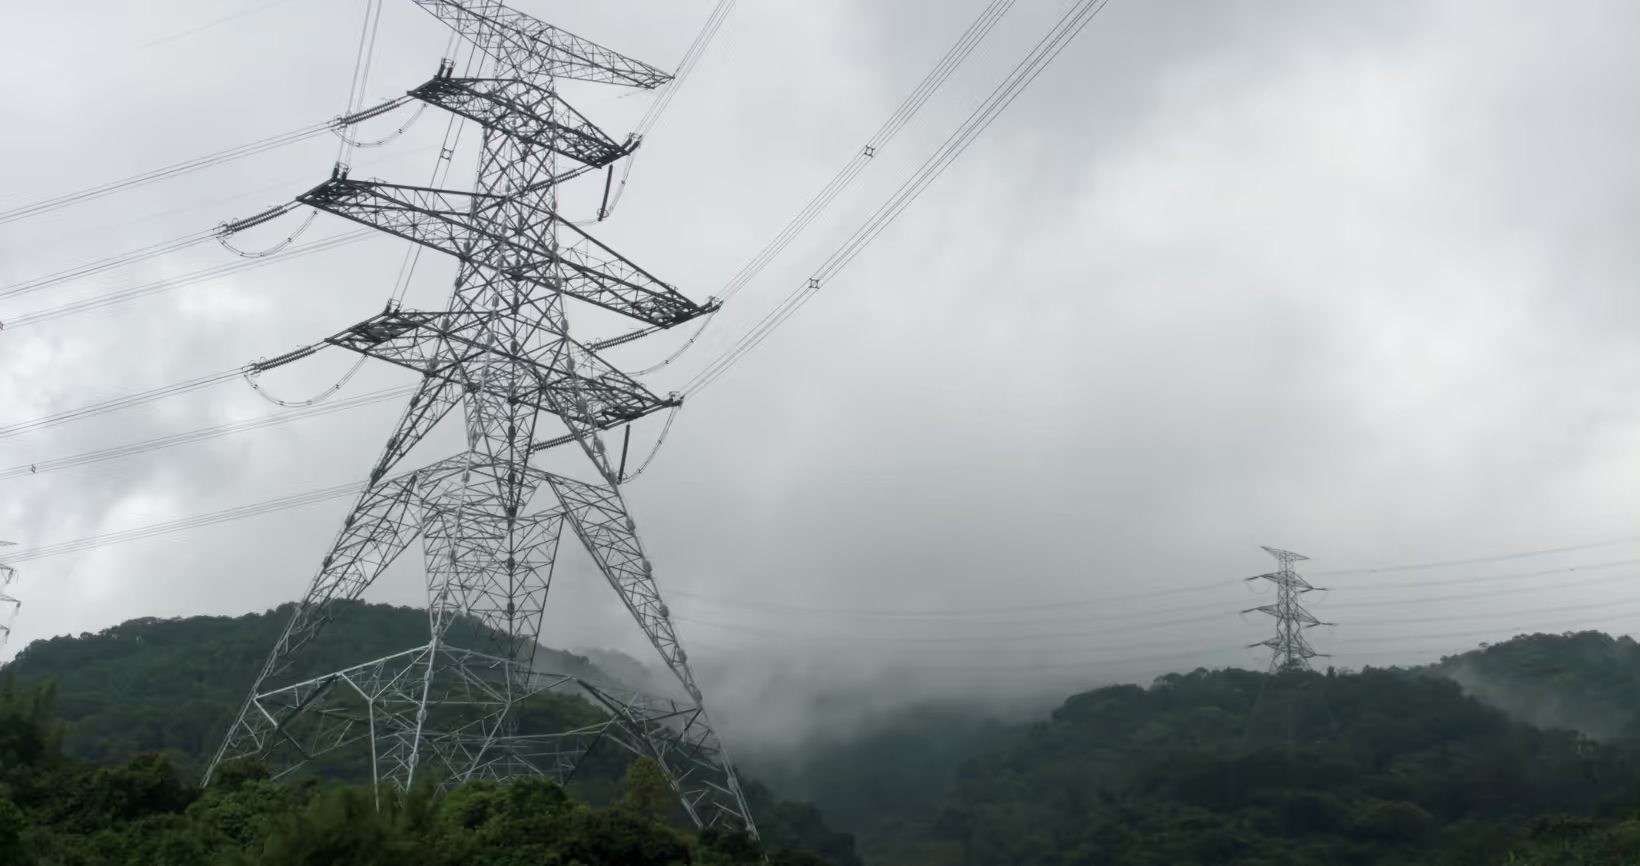
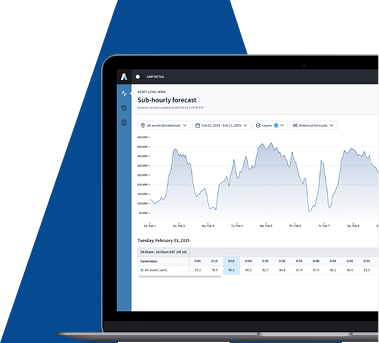
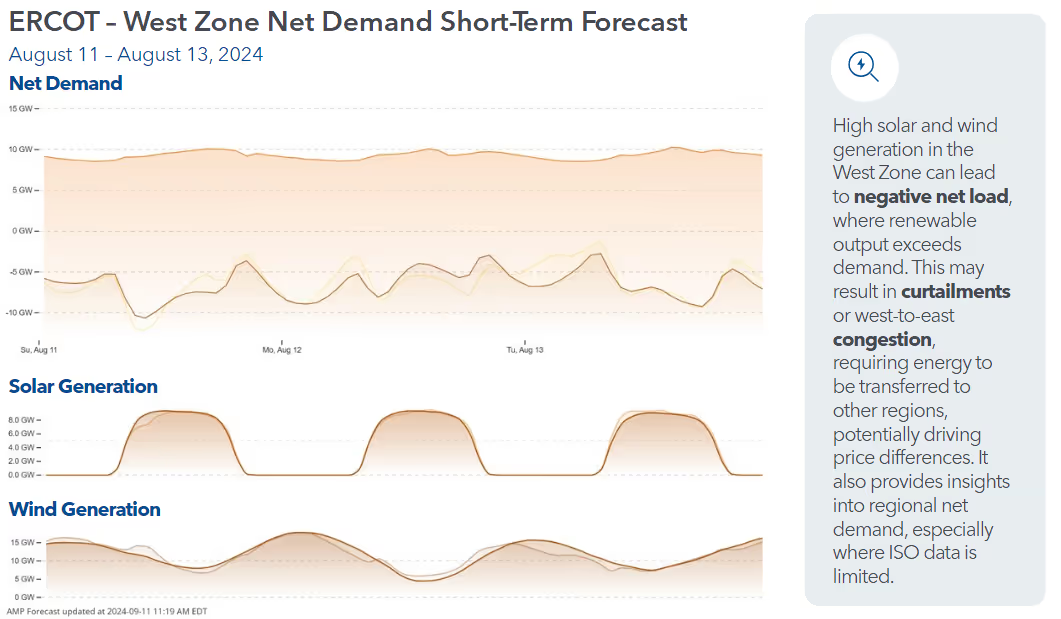
To keep the lights on, our energy grid must be perfectly balanced. Presenting the age-old question of how much? How much energy do we need to generate to meet demand the next hour, day, or week?
Our AI-powered demand forecasting methodologies are at the forefront of the energy transition enabling our customers to answer the question of “how much?” with more precision than ever before. Our unique core competencies, including our domain expertise, weather insights, and data cleaning capabilities, distinguish us from traditional methods.
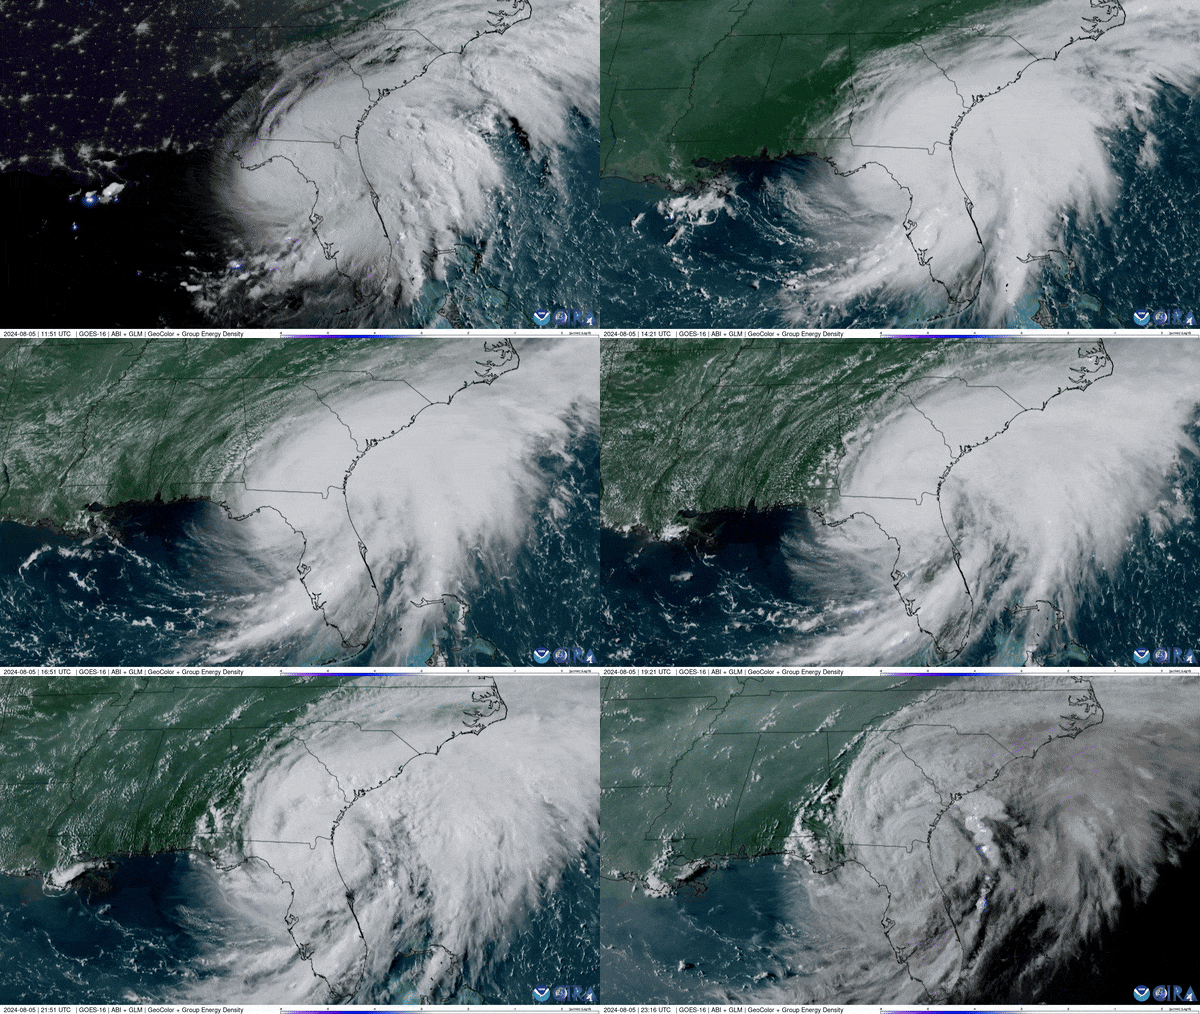
Weather data is one of the biggest inputs into our forecasts. We emphasize both quality and quantity when discussing our weather data. Historically, energy market participants have been limited by computing power, forcing them to rely on limited weather points to forecast dynamic weather systems. In contrast, we operate with a staggering amount of weather data: Forecast data and historical data for 40,000 weather points around the world; 20 distinct weather variables across four different weather vendors including temperature, wind speed,dew point, and irradiance. Our extensive and high-quality weather data allows for hyper-accurate and comprehensive forecasting.
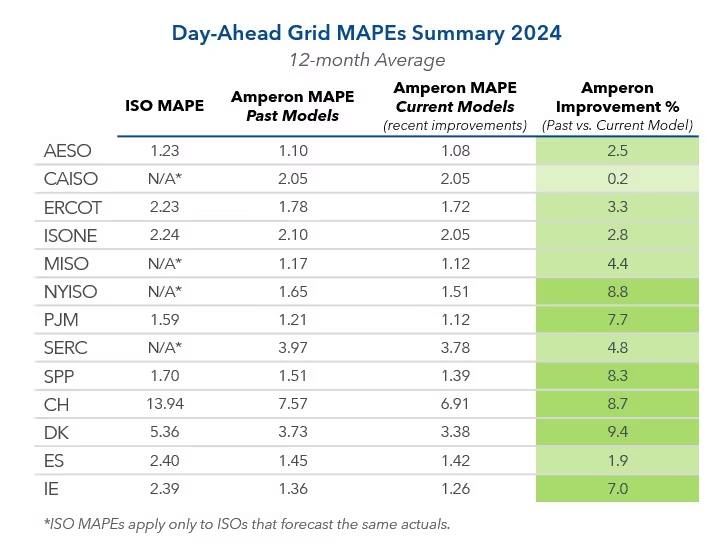
Energy data is notorious for its messiness and incompleteness. We invest significant resources and expertise to clean data before inputting into our AI models to ensure the most precise forecast. By combining our core competencies, we can apply our methodology to any market worldwide. Each market is nuanced, whether you are a participant in an RTO, ISO, or deregulated market, but the challenges remain consistent—how to clean data and optimize it for our forecasting models. These methodologies result in our industry-leading MAPEs (mean absolute percentage error), a common forecasting methodology that allows market participants to evaluate the accuracy of different forecasts.
Short-term vs Long-term Forecasts
Amperon segments its forecasts between short-term (15-day outlook) and long-term (5+ years) forecasting periods. We use a combination of regression models and gradient-boosted machine learning models to predict energy demand and generation.
- Our short-term models follow industry-standard availability of two-week forward-looking weather predictions to forecast demand.
- Our long-term models simulate various weather scenarios to present a range of potential outcomes. We take 15 years of historical weather data and simulate thousands of different possibilities for our customers.
Grid-level vs Meter-level Forecasts
Our approaches also differ when forecasting at the grid-level versus the meter-level.
For individual meters, such as a single-family home, Amperon uses highly localized weather data, pinpointed within 1-5 kilometers of individual homes, to provide highly accurate predictions. In comparison, typical forecasting methods use meteorological station data from the nearest major airport, which could be 100+ kilometers away from the home under analysis.
Our grid- level analysis weighs population density alongside weather variables to accurately consider load responsiveness to weather changes. Our grid-level forecasts also benefit from aggregating data across many meters, which smooths out anomalies and enhances overall accuracy.
Handling Different Data: SCADA vs EDI vs AMI
Energy data comes in a variety of different formats, which ranges in accuracy and quality. No matter the format, Amperon does the hard, nitty, gritty work to ingest, manipulate,and store that data.
- SCADA (Supervisory Control and Data Acquisition) - SCADA systems capture real-time raw, telemetry meter data. We ingest this data through our upload portal and apply intelligent data preprocessing capabilities to identify inaccurate and missing data. This process employs algorithms to identify data errors and impute actuals by comparing submitted load to modeled load.
- EDI (Electronic Data Interchange) - EDI data provided by independent system operators (ISO) and utilities provide utility account, invoicing, and meterdata. We connect to utility systems to access the load profile and undergo data cleaning to fix common data anomalies including missing data.
- AMI (Advanced Metering Infrastructure System)- We collect AMI data where available by utilities which gives our team 5- to 15-minute intervals of load history.
- Revenue-grade monthly invoices – We also access revenue quality data from monthly utility invoices.
Setting Ourselves Apart
We have consistently outperformed our competition in forecasting accuracy due to our domain expertise, high-quality weather data, and rigorous data cleaning processes. Contact us today to learn more about how we can help your business navigate the changing dynamics of the electricity grid.


.svg)





%20(3).png)
%20(2).png)
%20(1).png)





.png)


.avif)


.avif)
.avif)

.avif)
.avif)
%20(15).avif)

.avif)
%20(10).avif)

.avif)

.avif)
.avif)



.avif)







.avif)

.avif)




.avif)



.avif)
.avif)


.avif)

