

This is the second entry in a three-part series about the types, formats, benefits, and limitations of the data Amperon ingests and provides to deliver world-class energy forecasts to our customers. Read Part 1: Granular Weather Data here.
Why does generation data matter?
Amperon offers grid-level demand, net demand, and price forecasts, custom-built demand forecasts, and asset-specific generation forecasts.
Unlike many asset forecasting vendors in the space, Amperon combines machine learning models with physics-based models to predict the precise generation output of a given asset on an hourly or sub hourly basis. We achieve this by considering not only the past generation data of the asset, but also physical characteristics of the asset, also known as metadata, ensuring more accurate and reliable predictions.
You can read more about recent improvements to our asset forecasting accuracy here.
Generation History
First order of business: generation history. Our machine learning models use historic generation data, described below, to create best-in-class forecasts.
We match your historic data to weather data, daylight information, and the other metadata described below in order to train our machine learning models.
Where does this data come from?
- Generation data for an asset generally comes from a Supervisory Control and Data Acquisition (SCADA) system, which measures the energy generation output of an asset. Sometimes other metadata, such as wind speed, panel efficiency, and outage data is available as well. Typically, a customer is able to export their generation data from these systems as a CSV file (or similar) and upload it to our platform.
- Some common SCADA systems used by our customers include AVEVA and Bazefield.
- We require generation data, per asset, that matches the granularity of the forecast being generated. For example, customers who subscribe to hourly forecasts upload hourly generation data, and customers who subscribe to 5-minute forecasts upload 5-minute generation data. Generation data is in kilowatts, with timestamps identifying the end of the interval.
- Historic curtailment and availability data, if available, are ingested in order to improve model accuracy.
- Weather data measured by the customer on-site, such as windspeed or irradiance, is ingested when available to further improve accuracy.
Types of Data Relevant to Both Solar and Wind Assets
Nameplate Capacity
Nameplate capacity refers to the maximum amount of generation an asset can theoretically reach, if operated in a laboratory setting. In practice, factors such as time of year, panel angle, clouds and dirt will prevent assets from reaching this theoretical high point. However, it’s a useful benchmark to use. In fact, we use nameplate capacity to evaluate the accuracy of our forecasts.
Location of Asset
Lat/long coordinates of an asset allow us to use precise weather forecasts to predict an asset’s generation. For added precision when dealing with large assets, we are able to ingest shapefiles showing the boundaries of a given asset, or even files showing the specific location of wind turbines.
Historic Curtailment and Availability and Potential Power
Curtailment typically refers to periods where the asset manager is reducing an asset's max power based on external factors (ie, price of energy, grid load capacity, regulatory requirements).
Availability represents the potential power of the asset based on the percentage of the asset that is currently online. Assets occasionally have periods of reduced availability due to internal factors (maintenance or unexpected outages), leading to a reduction in potential generation.
When customers are able to send historic generation data with curtailment and availability pre-tagged, their custom training data benefits greatly. Without these tags, the models will struggle to make sense of reduced generation during times when all asset- and weather-specific factors would suggest high generation.
Solar Assets
Solar assets have specific types of metadata that allow us to build a physics-based model and tune our machine learning models appropriately. Here are some types of metadata about solar generation assets that we consider.
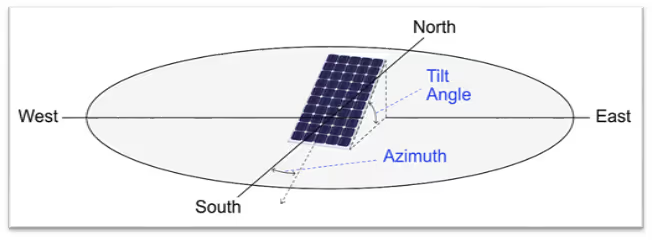
Panel Orientation and Site Azimuth
Panel orientation refers to the default tilt of the panel. Azimuth refers to the default cardinal direction that the panel is facing. Both of these can be adjusted either in real-time or seasonally as described below. We intake the default tilt for reference, so that tilt and rotation magnitude and timing can be compared to a baseline.
Axis (Fixed Tilt vs Tracking)
Some solar panels are static in space, while others are built to automatically track and tilt towards the sun on one or more axes.
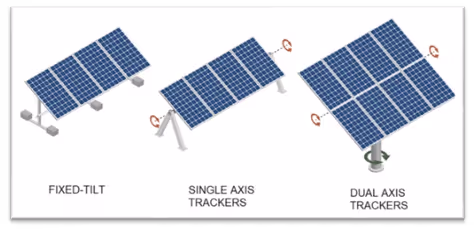
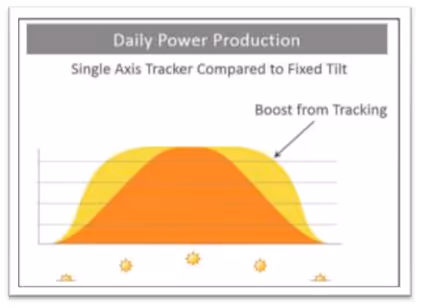
Solar assets consisting of fixed-tilt panels are cheaper to construct and operate, while tracking boosts generation capacity.
Panel tilt range (+/- degrees)
Clearly, information about the current panel angle, as well as information about potential degrees of tilt built into the system, are crucial for accurate generation forecasts.
“Fixed-tilt panels” can still be adjusted manually to optimize seasonal generation, so panel tilt range and up-to-date tilt information are relevant to all solar assets.
Ground Coverage Ratio (%)
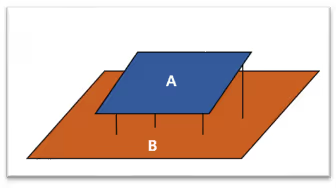
Ground Coverage Ratio (GCR) represents how much of the available ground the solar panels cover. A higher GCR indicates a denser gathering of panels, and a lower GCR means the panels are more spread out.
Since a higher GCR means the panels are packed more densely, it seems intuitive that a higher CGR would lead to more efficiency per acre and therefore higher generation. However, our models have already ingested nameplate capacity. GCR, then, lets us account for one small detail: locating panels very close together can lead to self-shading, in which panels are blocked by shadows from neighboring panels during certain times of the day.
Wind Assets
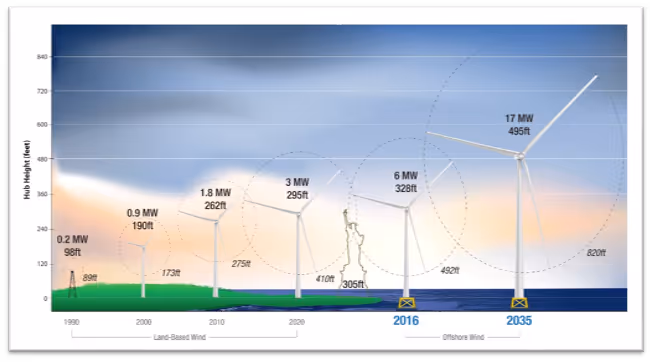
Hub Height (meters)
Hub Height refers to the average height of the turbine centers. Windspeed is notoriously hard to predict, and elevation is one factor that influences windspeed. Here at Amperon we have several different weather forecast options. With a precise hub height, we can pull the appropriate windspeed forecasts for each customer’s farm. Currently, we can ingest one hub height value per farm; if a wind asset has multiple heights of turbines, we use the average.
Windspeeds can vary significantly with altitude. Often, a phenomenon called wind shear means that winds several meters above trees and built structures, undisturbed by these obstacles, gain velocity and energy over hundreds of miles. Wind turbines are becoming taller each year in order to better capture this energy (DOE).
Years ago, having a single windspeed height for all wind assets would have been reasonable. Today, however, sourcing weather vendors that provide appropriate wind height forecasts affects the accuracy of generation forecasts.
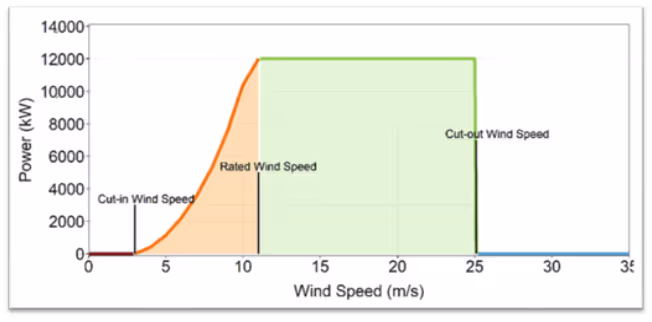
Cut-in Speed (m/s) and Cut-out speed (m/s)
Cut-in speed and cut-out speed refer to the minimum and maximum wind speed at which a wind turbine begins generating power.
Below the minimum, the wind is not strong enough to overcome the mechanical resistance of the turbine blades, so no electricity is generated. Above the maximum, the turbine will shut down to avoid damaging its components.
This data allows us to correlate weather forecasts for wind speed with the operational window of the given assets.
Why Does This Data Matter?
From construction and installation to current operations and generation history, every aspect of a renewable asset provides insights into its expected generation over the next fifteen days as we build a short-term forecast. All told, we ingest diverse sources of asset-related data in order to build both physics-based models and AI/ML models.
When combined, these two types of models capture the generation potential of every solar asset and wind turbine on a customer’s site. We combine this data with the weather data described in Part 1 to achieve industry-leading accuracy. Our customers, in turn, achieve optimal returns on their assets, taking advantage of every opportunity to make smarter trading decisions.


.svg)


%20(3).png)
%20(2).png)
%20(1).png)


.png)


.avif)


.avif)

.avif)


.avif)


.avif)
%20(15).avif)

.avif)


.avif)


.avif)

.avif)


.avif)


