This is the first entry in a three-part series about the types, formats, benefits, and limitations of the data Amperon ingests and provides to deliver world-class energy forecasts to our customers.
Why is Weather Data so important?
Amperon was founded by energy industry veterans who knew that weather data is key to predicting energy demand and generation patterns. Demand is simply higher on extremely hot and cold days, when A/C and heating systems are in use, than on more temperate days. But that is, of course, a gross oversimplification. Solar panels consistently generate electricity when it’s sunny. And wind turbines require a certain amount of windspeed at a precise height and location in order to generate electricity.
As we’ve grown, we’ve recruited a world-class data science team with our Chief Data Scientist, Ydo Wexler, as our first hire. Every time they are modeling something new; their first order of business is to identify and ingest the weather data. Grid demand, net demand, asset solar, and asset wind models from Amperon all start and end with weather data analysis.
Given the importance of weather data, our company’s second hire was Dr. Mark Shipham, a PhD meteorologist with experience both at NASA and on the energy trading floor. Fun fact: Our CEO Sean Kelly met Mark while working on E.On’s trading desk. Mark is invaluable to our team, as he brings expert experience and interpretation of weather forecasts. You may have seen his seasonal weather webinars, providing insights to the public, or his daily emails with weather updates broken down by region. As you can imagine, he is just as useful behind the scenes.
Where do we get our weather data? What data do we use? What do we do with it?
Weather Points: Sampling Density
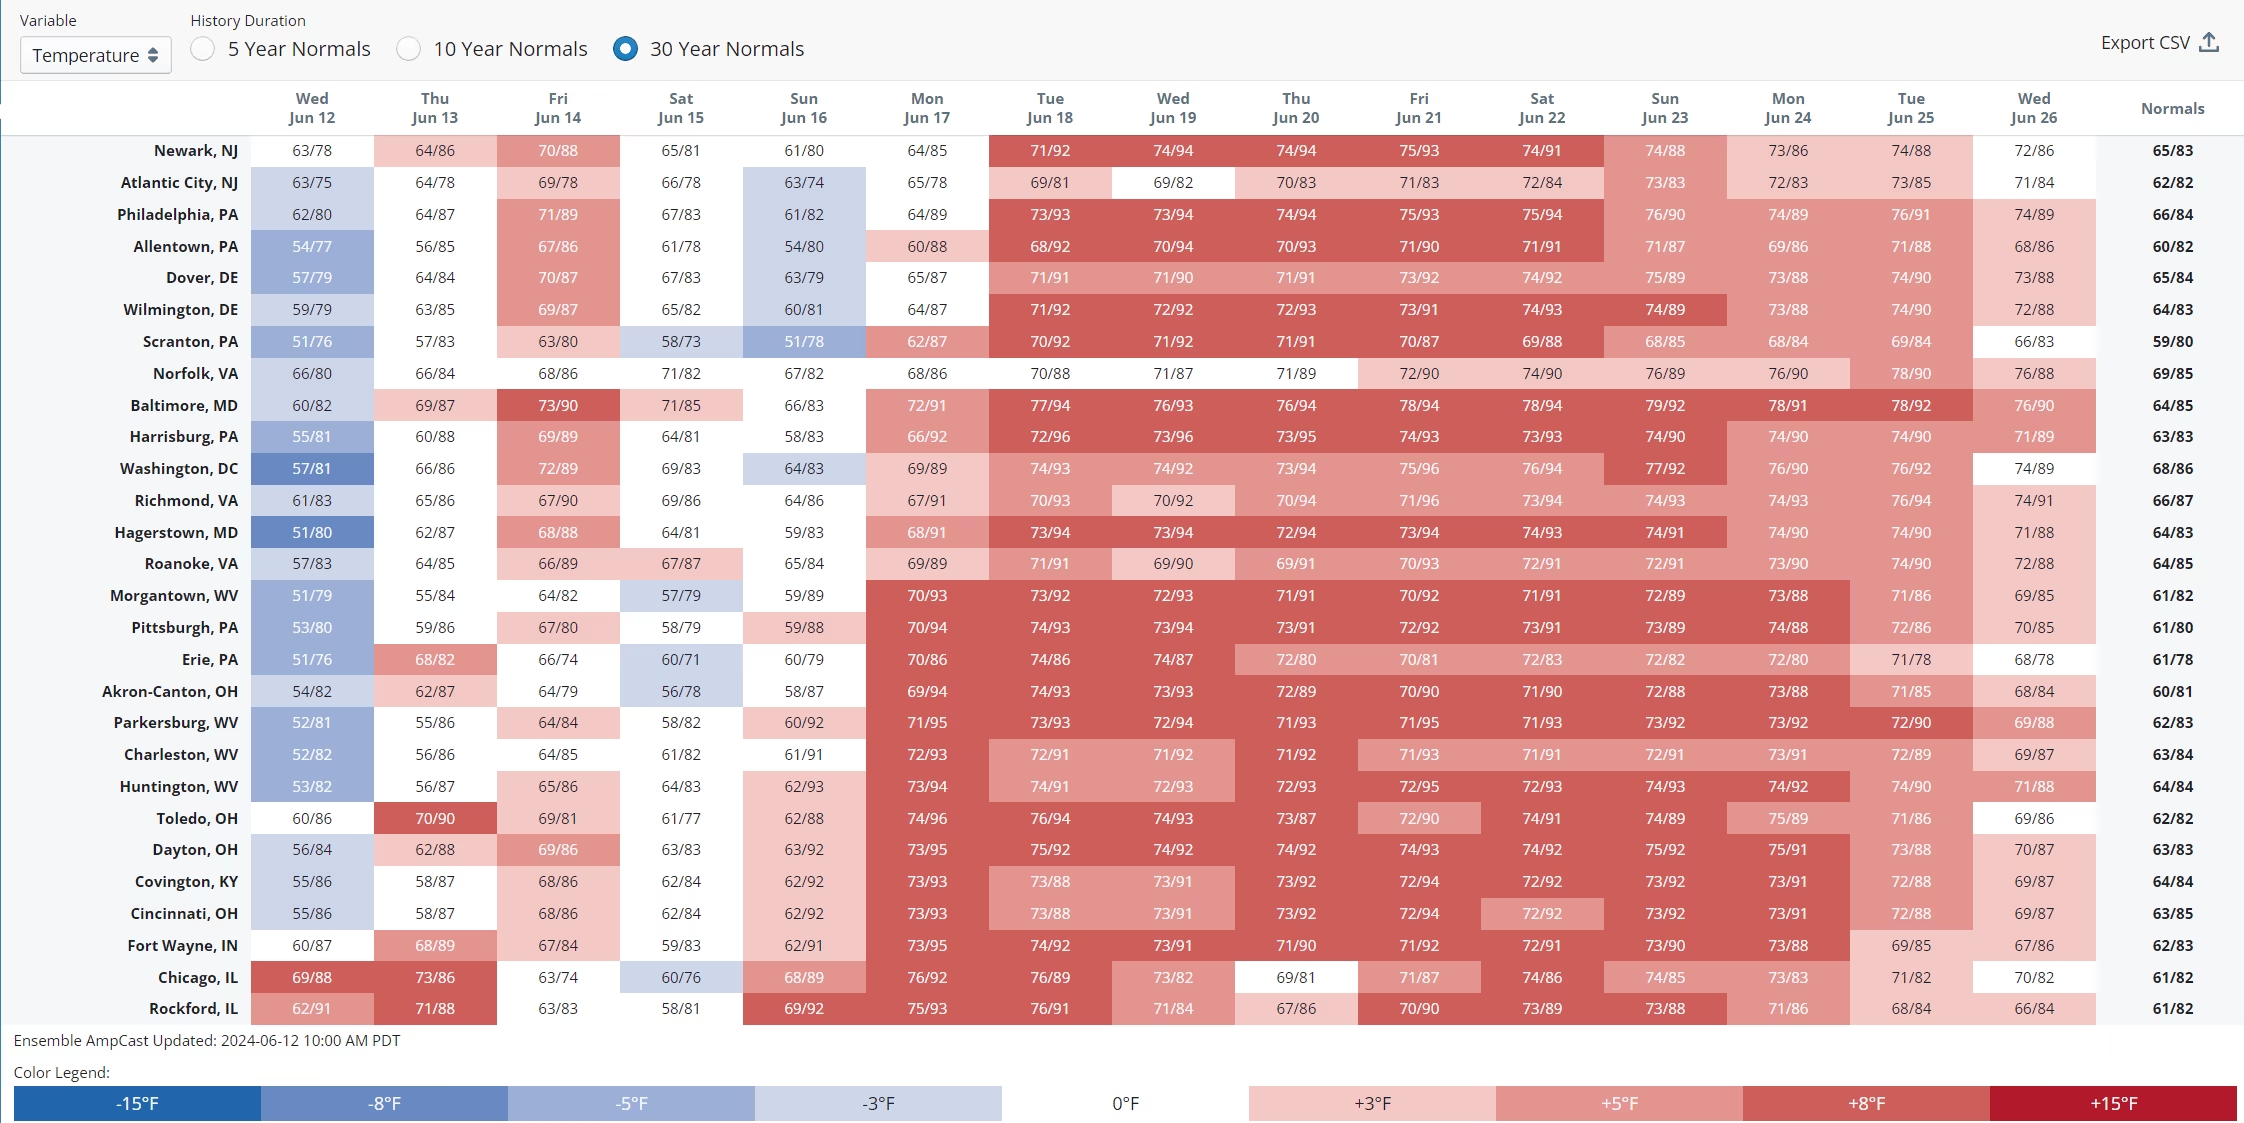
Across the energy industry, it is common to see forecasting providers only sample weather at airports. This is understandable – it is easy to access that data, and airports are often located near population centers. But they are by no means located in downtown cores or sited with energy demand in mind. Furthermore, a quick search will tell you that it is common for temperatures and precipitation to vary dramatically within a single city.
Rural customers, too, often have discrete demand centers that may be separated into different microclimates. Since weather can vary dramatically over just a few miles, this sparse weather sampling can lead to misses in demand forecasts. This is especially relevant during extreme weather events, when systems are already peaking, and prices are high.
At Amperon, our models pull weather data every 1km, 5km or 10km based on population density to mirror your asset and infrastructure footprint. In total, we ingest weather data from just over 40,000 points across North America and Europe. With 100,000+ weather points available from our vendors, this population-weighted sampling ensures that the strength of the weather signal is correlated with the number of energy consumers who are actually affected by that weather – leading to more-precise forecasts.


Weather Forecasts
Although we have no intention of creating our own weather forecast, we do invest heavily in evaluating all weather forecasts available on the market. For our Grid Short-Term Forecast, and our Asset Solar Forecast, we build energy forecasts based on our vendors’ weather forecasts, then blend them together to create an Ensemble Forecast that optimizes our accuracy and significantly mitigates the risk of relying on any one vendor for our weather forecasts.

Customers can access our Ensemble Forecast and the AG2-based forecasts by default. The Advanced Weather add-on offers forecasts based on other vendors’ weather, as available.
Our weather vendors are:
Atmospheric G2, or AG2, formerly WSI, provides a comprehensive package of market-leading weather forecasts and an extensive suite of historical data across the globe.
DTN delivers sophisticated weather insights that help drive millions of operational decisions worldwide every minute of every day. Significant investments in a cloud-native, global weather data platform enables the modeling of distinct DTN historical weather data.
National Blend of Models (NBM)
The NBM is a service of NOAA, and is available for free through the US government. It’s based on weather data from 122 weather offices, constituting 44 different global weather models that are ensembled together.

By utilizing low-Earth orbit satellites and advanced radio occultation data, Spire delivers precise atmospheric measurements and enhanced weather predictions worldwide, providing unmatched precision and critical insights for a competitive edge. Spire-powered Amperon forecasts are available in ERCOT (Texas) only.
Future Weather Vendors
We are actively following new developments in the weather-forecasting space. There are some AI-powered models coming out from Big Tech that are showing some promise; we are actively exploring and evaluating these as they become available.
How do these vendors, companies or agencies acquire weather data?
Every weather model has its own “secret sauce,” but ultimately, weather forecasts are based on observations of current weather cues. Different sources acquire weather data in different ways.
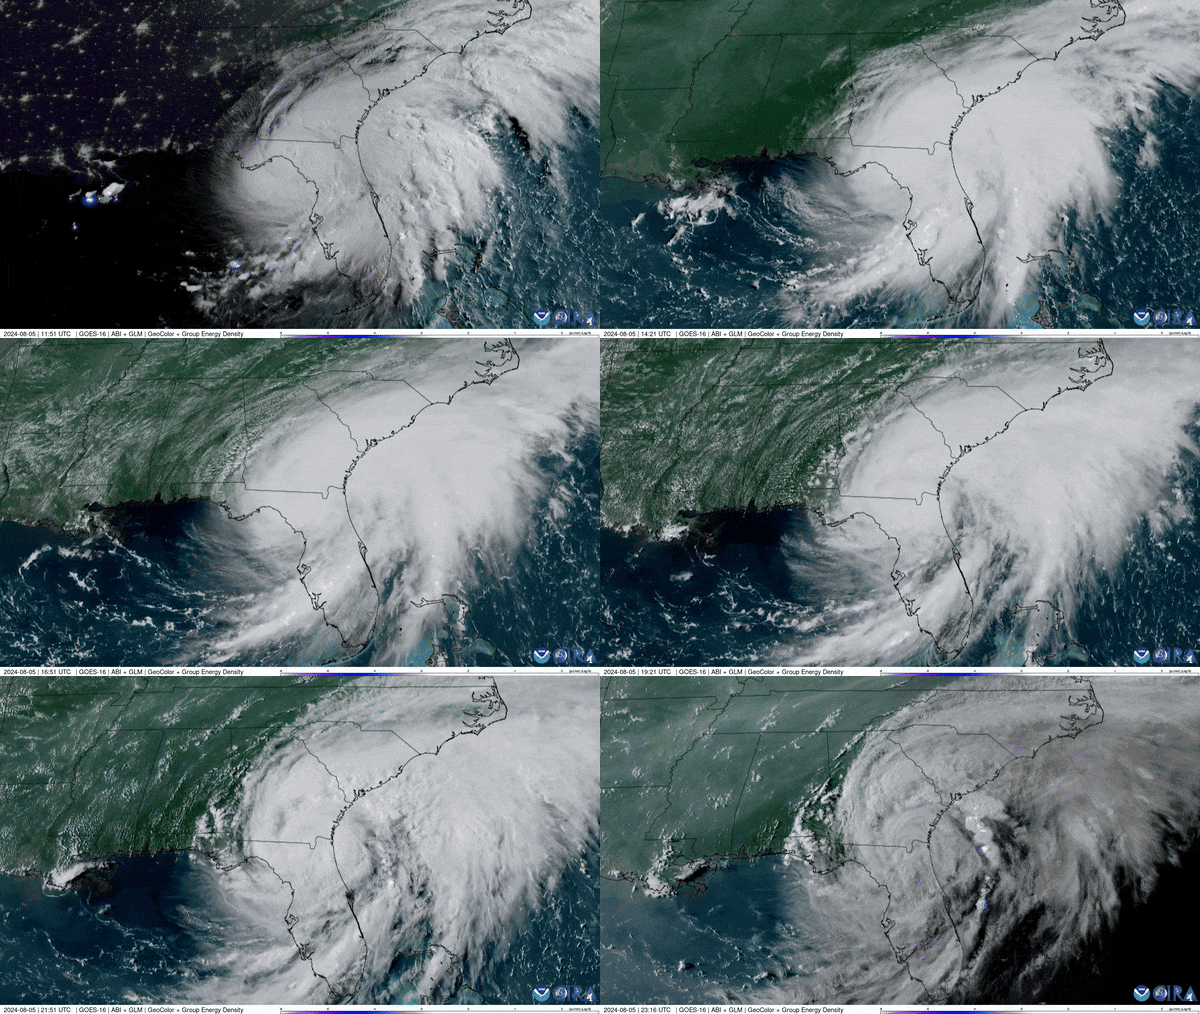
- GOES (Geostationary Operational Environmental Satellite) 16 and 18 satellites: Great for cloud cover, fog, water vapor, wild fire smoke, Saharan dust, sea surface temperature data, space weather hazards (navigating disruptions and power blackouts)
- Integrated Surface Data (ISD) and METAR Data
- Weather Models like the GFS, ECMWF (Euro), HRRR, NAM
How often are weather forecasts updated?
Data from weather stations and satellites can update as frequently as every 30 seconds, though weather forecast models take some time to ingest new data into their models.
We pull weather forecasts from these four vendors once each hour. Then, we integrate the weather forecasts into our demand and renewable generation AI models in order to refresh our short-term forecast.
Which weather variables are most predictive of energy demand and renewable generation?
We pull about 20 weather variables from our weather vendors. In some cases, we watch how these variables change over time, consider moving averages, or transform them in other ways before they are included in our models.
Some of the most influential weather variables in Amperon’s demand forecast include temperature, wind speed in various directions and at various heights, radiation, and relative humidity. But we also provide raw variables for:
- Heat Index
- Dew Point
- Visibility
- Wind Gust
- Wind Chill
- Precipitation
- Cloud Cover
- Atmospheric Pressure
Next Steps
Our AI algorithms continuously learn and update with new data, allowing the models to evolve dynamically. This adaptability enables our models to respond to ever-changing market conditions and identify patterns in large datasets that may have previously gone unnoticed.
It's important to recognize that weather data involves more than simply providing a temperature forecast. To accurately utilize this data, you need to consider the sources of your weather information and how you integrate it into your models for demand, pricing, and renewable energy.
Interested in seeing how better weather translates into more accurate forecasts?
.avif)


.svg)





%20(3).png)
%20(2).png)
%20(1).png)





.png)


.avif)


.avif)
.avif)

.avif)

.avif)
%20(15).avif)

.avif)
%20(10).avif)

.avif)

.avif)
.avif)




.avif)







.avif)

.avif)


.avif)



.avif)
.avif)


.avif)


