A variety of different metrics are used to measure the performance of deterministic forecasts. These metrics serve various purposes, such as comparing forecasted and measured values and assessing the performance of multiple forecasts. Below, I highlight a couple of different kinds of measurement techniques and explain how we use them at Amperon to benefit our clients.
MAPE
Mean Absolute Percentage Error (MAPE) is the most common metric for assessing the accuracy of load forecast models. It measures the average absolute percentage difference between predicted and actual values. MAPE is especially useful when evaluating strictly positive values but can falter when the values approach zero or go into the negatives due to its mathematical instability.
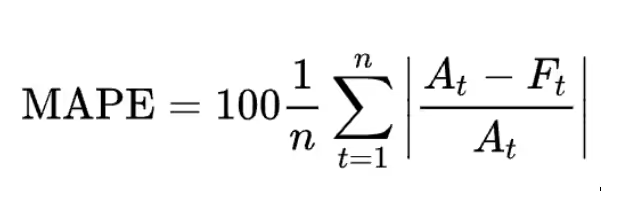
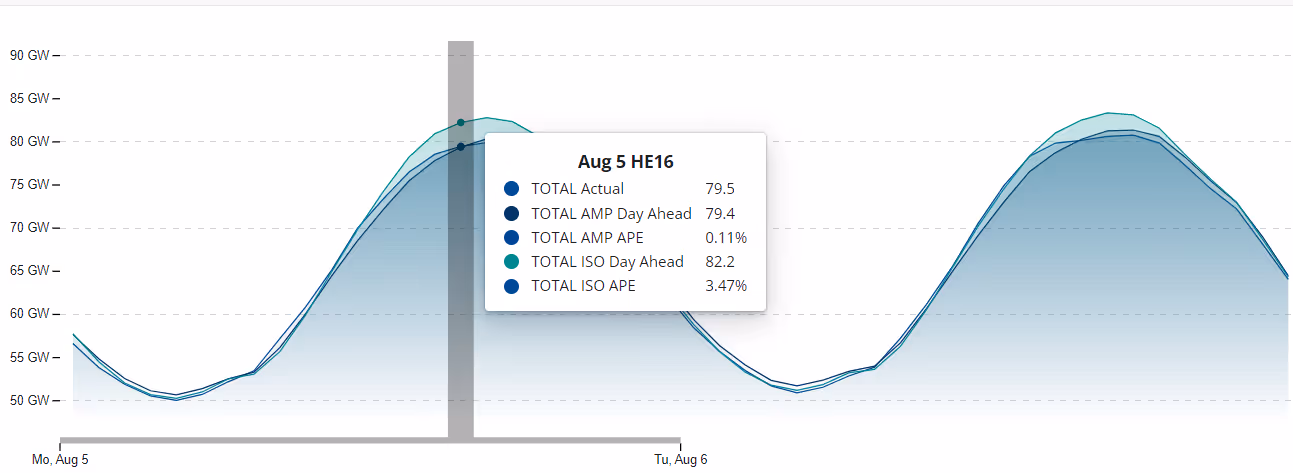
At Amperon, our MAPE is based on our day-ahead forecasts. When comparing MAPEs, it’s important to note the timeframe the calculations are referring to. Amperon posts the APEs, and the ISO APEs, directly in the platform for each hour. (APE is the Absolute Percentage Error and only refers to an hour while MAPE is the mean APEs over a specific period.)
Weather Actual MAPE
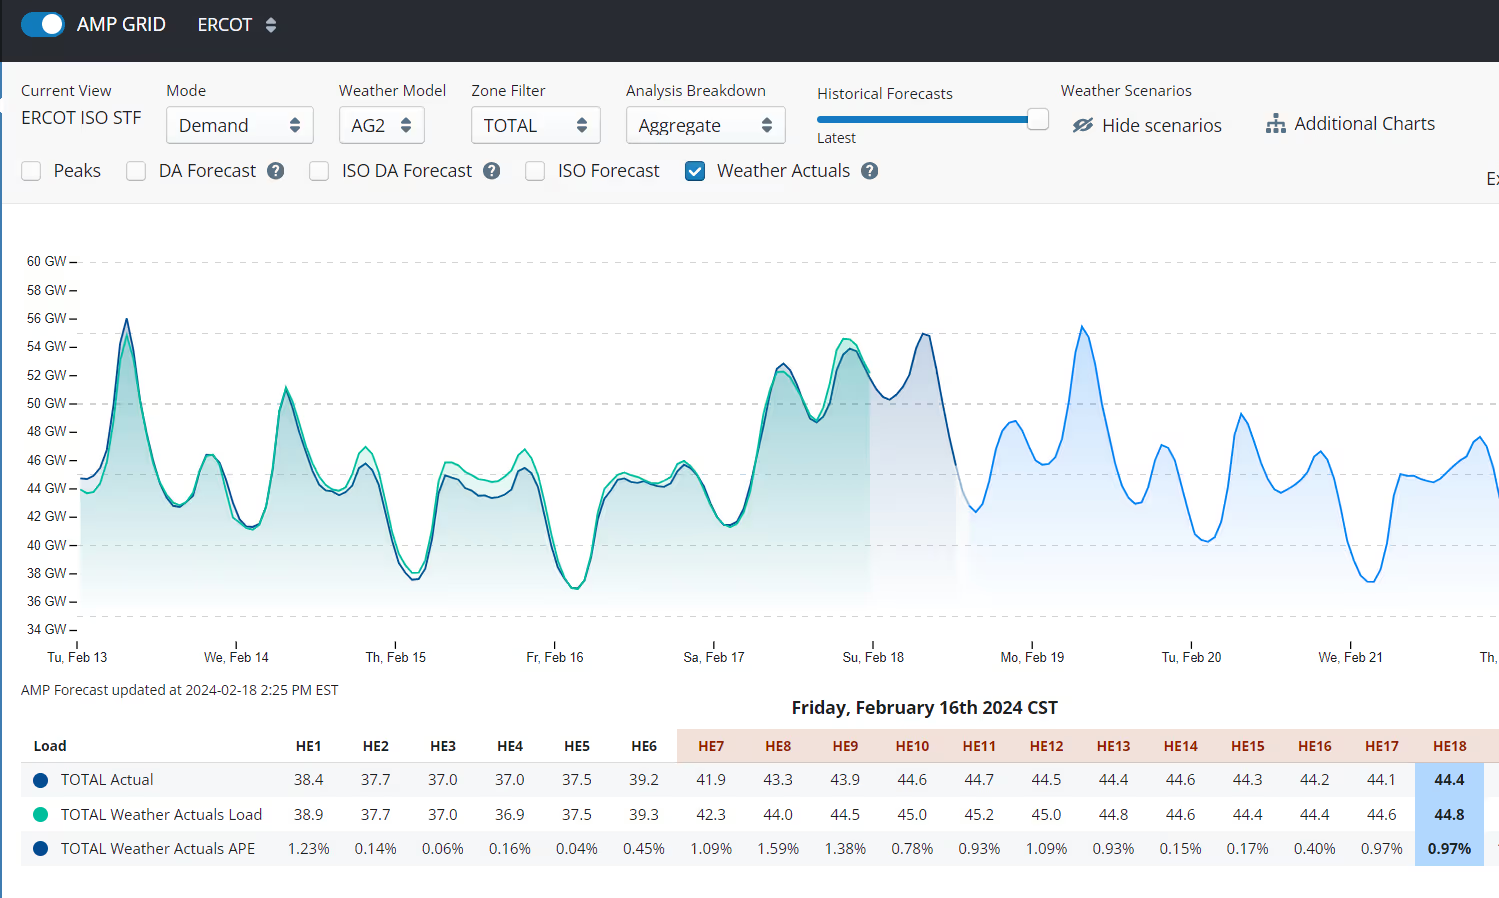
Sometimes referred to as, “Adjusted Backcast MAPE,” this is calculated by rerunning predictions after the weather occurred, using the actual weather, instead of the forecasted weather. At Amperon we use Weather Actuals to determine if a forecast miss was due to weather predictions being different than the actual weather, or if it was due to a modeling error. This makes it easier for customers to understand how the forecasting models are performing.
nMAE
Normalized Mean Absolute Error (nMAE) is the average absolute difference between the predicted values and the observed values normalized by the mean value observed. NMAE is sometimes a better metric than MAPE when evaluating forecasts for regions with an increased adoption of rooftop solar when demand is close to zero or negative.
It’s easiest to comprehend, however, it is sensitive to the average values across the evaluation period. For instance, in solar generation at the individual asset level, it can produce exaggerated errors for winter evaluations, when the average generation is minimal, and depreciated errors in summer when generation spikes.

RMSE
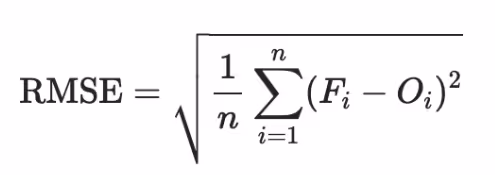
Root Mean Square Error (RMSE) calculates the root of the average squared differences between predicted and actual values. This error measurement is particularly useful when accounting for significant prediction misses but is scale-sensitive and needs calibration when comparing errors across different domains or assets.
New! cnMAE
For solar and wind assets, cnMAE scales the forecast error according to the system's nameplate capacity. This presents a relative error measure, ensuring that the scale of the system and the values observed during the estimated period do not influence the error score. Simply, cnMAE = MAE/Capacity.

The Right Metric for Asset-Level Solar Forecasts
Predictive error, though inevitable, can have a profound impact on decision making and outcomes that rely on forecasting in the utility industry. And with the increasing number of solar photovoltaic power plants coming online, solar forecasting at the asset-level is becoming more important for many players within the power and utility industry. Solar forecasting uses high-resolution weather data and AI-powered statistical modeling to predict the amount of solar energy that will be available at a specific time and location. To further accelerate the maturity of solar forecasting in the market, Amperon believes the industry should coalesce around a single, well-suited measure of predictive error. In our experience, cnMAE is the best option.

The benefits of cnMAE make it the just-right metric for solar and wind forecasting at the asset-level:
- Prevents Unintended Bias: Unlike other measurements, cnMAE maintains an unbiased context by providing capacity-normalized insights and reducing sensitivity to seasonality.
- Supports Comparability: cnMAE enables performance comparison between systems with different capacities. This makes it an ideal metric for diversified portfolios of single-site installations.
- Enhances Planning and Budgeting: Power producers can better prioritize maintenance and operations with the capacity-adjust insights of cnMAE.
To learn more about cnMAE and see some of our examples, you can download our whitepaper here.


.svg)


%20(3).png)
%20(2).png)
%20(1).png)


.png)


.avif)


.avif)

.avif)


.avif)


.avif)
%20(15).avif)

.avif)
%20(10).avif)

.avif)


.avif)

.avif)


.avif)


.avif)