Forecasting plays a crucial role throughout the energy field by providing essential insights and foresight. An accurate forecast requires having the most up-to-date data across multiple sources to facilitate efficient resource allocation, cost reduction, and demand planning. More specifically, the electricity industry relies on forecasts to reduce risk, balance supply and demand, produce hedges, make informed trading decisions, and ultimately, maintain reliability while accelerating decarbonization. Amperon’s forecasting solutions empower a diverse community of industry leaders to adapt to changing dynamics and ensure reliability, competitiveness, and sustainability across today’s increasingly volatile electricity grid.
But how do you understand and trust your forecast performance under countless iterations and circumstances?
On the surface, the answer seems simple. You need to have the proper data and tools in place to produce an analysis. However, to effectively demystify a large dataset and empower your organization’s decisions day after day, one must not only collect and review data, but rather, set up a pipeline that seamlessly integrates each stream of data into a single greater, centralized system.
And now, with Amperon’s recent launch of our grid forecast dataset on Snowflake, we are excited to unlock a new level of freedom, analysis, and performance for your organization. We partnered with Snowflake because they have an advanced data platform on public clouds (AWS, Azure, Google) that provides a single solution for warehousing, data lakes, engineering, science, and more. In other words, Snowflake is a self-managed service, enabling data storage, processing, and analytic solutions that are faster, easier to use, and far more flexible than conventional offerings.
To the user, Snowflake grants every benefit of an enterprise analytics database, coupled with many extraordinary features and state of the art capabilities. Amperon’s industry-leading customers can now take advantage of this functionality with access to our entire forecast history, along with a set of remodeled, purpose-built, comprehensive secure views.
In more detail, we’ve engineered our share to empower users to analyze our forecasts, vintages, weather, and accuracy against every ISO’s load actuals, forecasts, and accuracy. We can query a single view across any RTO/load zone, weather model, publication time, and time segment. Amperon partnered with top traders and engineers to structure our data to best support your research. In just a few lines of code, you can query across prediction hours and offset times, market hour ending (or beginning), UTC times, market time segments, as well as the number of days back from the forecast horizon. It's also never been easier to join our standardized time series data to other vendors or sources. If this seems of interest, please make a listing request here.
Why it matters for your team
Financial Traders, Asset Managers, Quantitative Analysts, Engineers, Developers, and System Administrators all have a part to play. Whether you need to integrate Amperon’s forecast across various internal and external datasets, models, programs, and visualizations, or automate and scale your forecast analytics, Amperon and Snowflake have the solution for you.
Our Customer Success and Technical Sales team continually partner with early adopters and mutual Snowflake clients to gather feedback, expand analysis, automate workflows, and develop custom-tailored solutions, with the added complement of Snowflake’s support. Together, we share the aspiration to reduce friction and make information readily available, so we intentionally retrofit this solution to streamline your analytics while providing world class support.
It’s much easier to slice our forecasts across various historical publication times, ISO’s and markets, load zones, weather models, market hours, and time segments. Below are some examples pulled directly from Snowsight’s Dashboarding tools.
First, here is an example of how to compare the Amperon forecasts from each weather model in ERCOT to see which weather vendor has the most accurate weather predictions over a certain period of time.

Next, we compare CAISO’s hourly APE scores against the different weather forecasts Amperon predicts on. You can see how CAISO has a much higher peak APE over the last 7 days compared to all four Amperon forecasts.

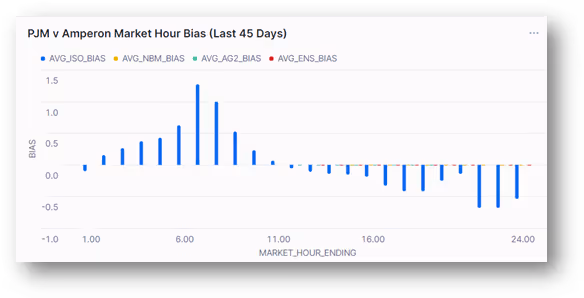
In the bar chart above, we charted the average bias by market hour ending in PJM over the last 45 days for the ISO and each of the Amperon weather sources. Forecast bias can be described as a tendency to either over-forecast (forecast is more than the actual), or under-forecast (forecast is less than the actual), which leads to forecast error. This visualization tells us that PJM tends to come in over in the morning and under in the afternoon; whereas Amperon optimizes its models to eliminate bias.
Snowflake’s environment is also ‘tech-agnostic’, which means we can deliver, process, and analyze Amperon’s forecast in nearly any language or program. Whether you are an analyst and prefer SQL to calculate bias, track the evolution of our accuracy over time, create win percentages, follow load profiles, gather forecast spreads, filter on percentiles, or determine weather modeling accuracy, the Snowsight interface is designed to simplify your analytical needs and is accessible via any modern browser. Additionally, Snowsight is meant to provide you with a distinct platform when it comes to accessing various sources of data from different vendors and teams. Not to mention it also includes the ability to share scripts, charts, and dashboards across your organization.
If you’re already hooked on Microsoft PowerBI or Excel, you can directly connect our Snowflake share to access a much greater, wider, and more performant data stream from Amperon, as we’ve released more columns and are no longer restricted by an ISO or model. And rest assured, Snowflake connects through Microsoft PowerQuery, and our team can either support your integration or build you a customized solution.
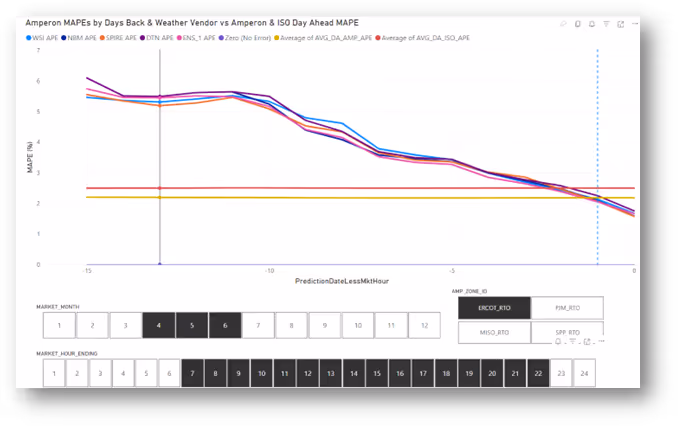
For example, we use this PowerBI dashboard to visualize MAPEs over the number of days back from the predicted market hour for each of Amperon’s weather forecasts and mark these against the average ISO (ERCOT) and Amperon Day Ahead MAPE.
Otherwise, if you are a developer accustomed to Python, Java, or Scala and are working to automate procedures, run user defined functions, schedule tasks, or develop custom applications and visualization tools, Snowpark serves to boost your performance, ease your development, and reduce computational costs by giving you the tools to operate solely within Snowflake’s cloud.
For example, Amperon users can set up predictions on top of Amperon’s forecasting data with the help of Snowflake AI & ML. This may be useful in better understanding our accuracy or feeding our forecast data into a model to predict price. Otherwise, with the help of Streamlit, developers can securely build, deploy, and share customized applications and visualization tools.
Whether you need all the above tools or not, everyone can appreciate having Snowflake’s warehouse to query millions of rows in less than a few seconds, with accuracy, weather, and ISO data included. Our views enable access to every forecast Amperon has ever published without restriction. Not to mention the views were built to be self-standing and do not require a series of complex joins to get the additional columns you need.
Energy forecasting is only getting more complex and competitive as new technologies and renewable assets are deployed on the grid. By using Amperon on Snowflake, you’ll be able to easily analyze the large swath of energy data for better insights into your forecasting needs.
Click here to view our Short-Term Demand Forecast listing on Snowflake Marketplace.


.svg)


%20(3).png)
%20(2).png)
%20(1).png)


.png)


.avif)


.avif)

.avif)


.avif)


.avif)
%20(15).avif)

.avif)
%20(10).avif)

.avif)


.avif)

.avif)


.avif)


.avif)

.avif)