On Saturday morning, our favorite furry forecaster, Punxsutawney Phil, saw his shadow, signaling six more weeks of winter – at least in his eyes. He might just be the most famous ‘meteorologist’ around, possibly even rivaling Jim Cantore.
But what does that really mean? The problem with Phil’s prediction is that he’s a bit vague. Where exactly will winter linger? And what does "six more weeks of winter" even entail?
According to the Climate Prediction Center, a much more reputable source, the next month and the upcoming three-month outlooks closely resemble NOAA’s 2024-2025 Winter Outlook. Warmer-than-normal temperatures are expected across the East and South, while colder-than-normal conditions are likely in the Pacific Northwest. As a local Bostonian, that doesn’t exactly scream six more weeks of winter. After the deep freeze that swept across much of the country in January, I’m not sure I’m mentally prepared for more of the same.
But what if Phil was forecasting for the West Coast? That would make more sense. Over the next few months, colder and wetter-than-normal conditions are expected in CAISO, the Pacific Northwest, and Northern SPP, while much of the country east of the Rockies is looking at a milder pattern. These regions haven’t felt the full force of winter yet, but now that we’re fully in a mild La Niña, it’s their turn to shine, or should I say, freeze. This could mean higher energy demand and, hopefully, solid snowfall to boost snowpack levels, not just for the ski crowd, but for spring hydroelectric generation as well.
Did you know: There are 71 weather-predicting groundhogs across the US? While Phil may be the most famous, he’s far from the most accurate. His track record sits at just 35%... Yikes!! Meanwhile, Staten Island Chuck boasts an impressive 85% accuracy rate. I don’t know about you, but I’m inclined to trust Chuck’s call for an early spring.
At Amperon, we understand that everybody has their own forecasting techniques. That’s why we let you stress test our demand forecasts based on your own weather preferences. With our scenarios feature, you can adjust the temperature forecast and instantly see how demand would shift over the next two weeks. Whether you’re planning for a best- or worst-case weather event (which, according to Phil, could be right around the corner), this tool gives you a strategic advantage.
East Coast: PJM
Punxsutawney Phil’s Predictions: Using Amperon’s weather scenarios, below is grid demand with –5, -10, and –15 scenarios.
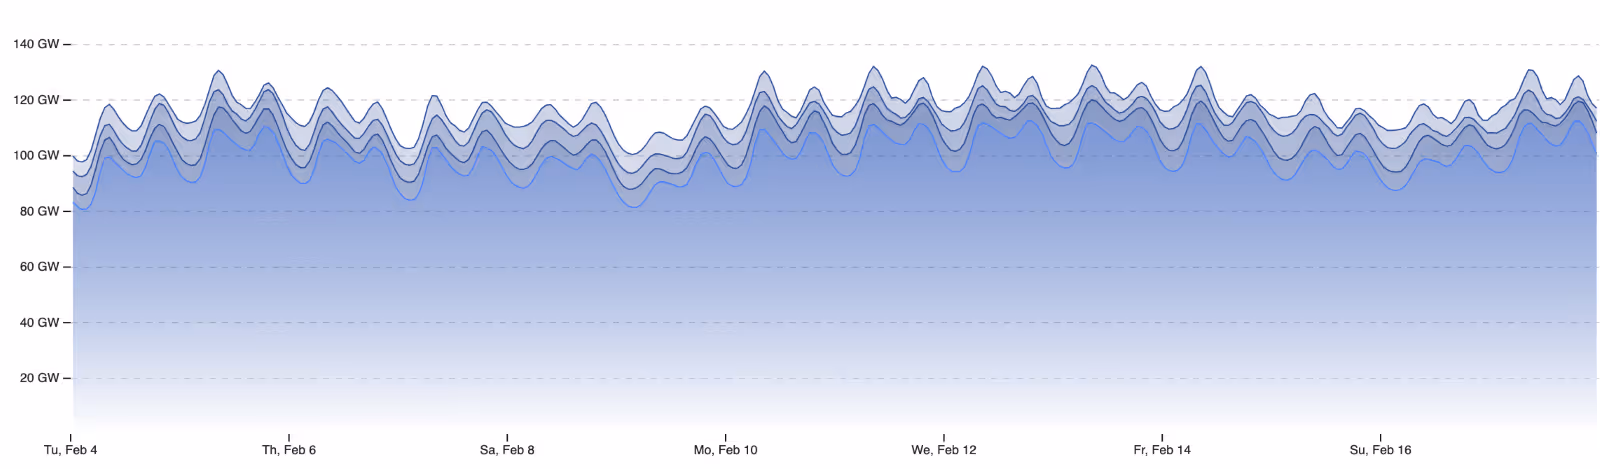
Staten Island Chuck’s Predictions: Grid demand with +5, +10, and +15 scenarios.

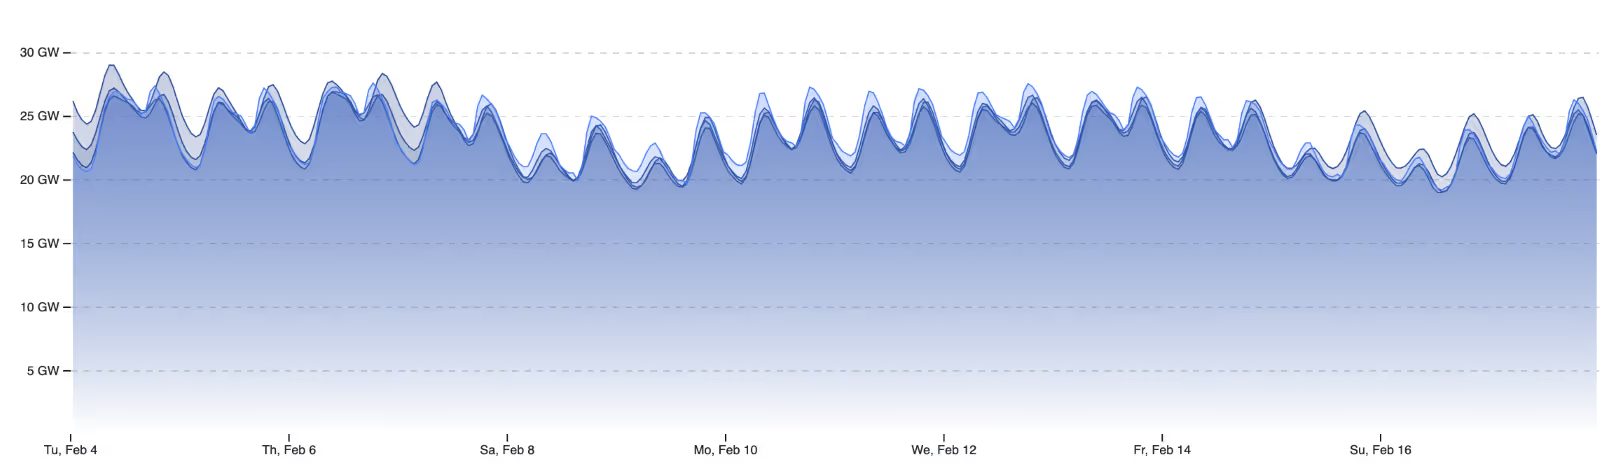
West Coast: CAISO
Punxsutawney Phil’s Predictions: Grid demand with –5, -10, and –15 scenarios.

Staten Island Chuck’s Predictions: Grid demand with +5, +10, and +15 scenarios.
To be clear, I’m not doubting Punxsutawney Phil, I just need a little more detail on his methodology. If it were up to me, I’d suggest he brush up on his geography and maybe sit in on an intro to meteorology class.
.gif)


.svg)


%20(3).png)
%20(2).png)
%20(1).png)


.png)


.avif)


.avif)

.avif)


.avif)


.avif)
%20(15).avif)

.avif)
%20(10).avif)

.avif)


.avif)

.avif)


.avif)


.avif)