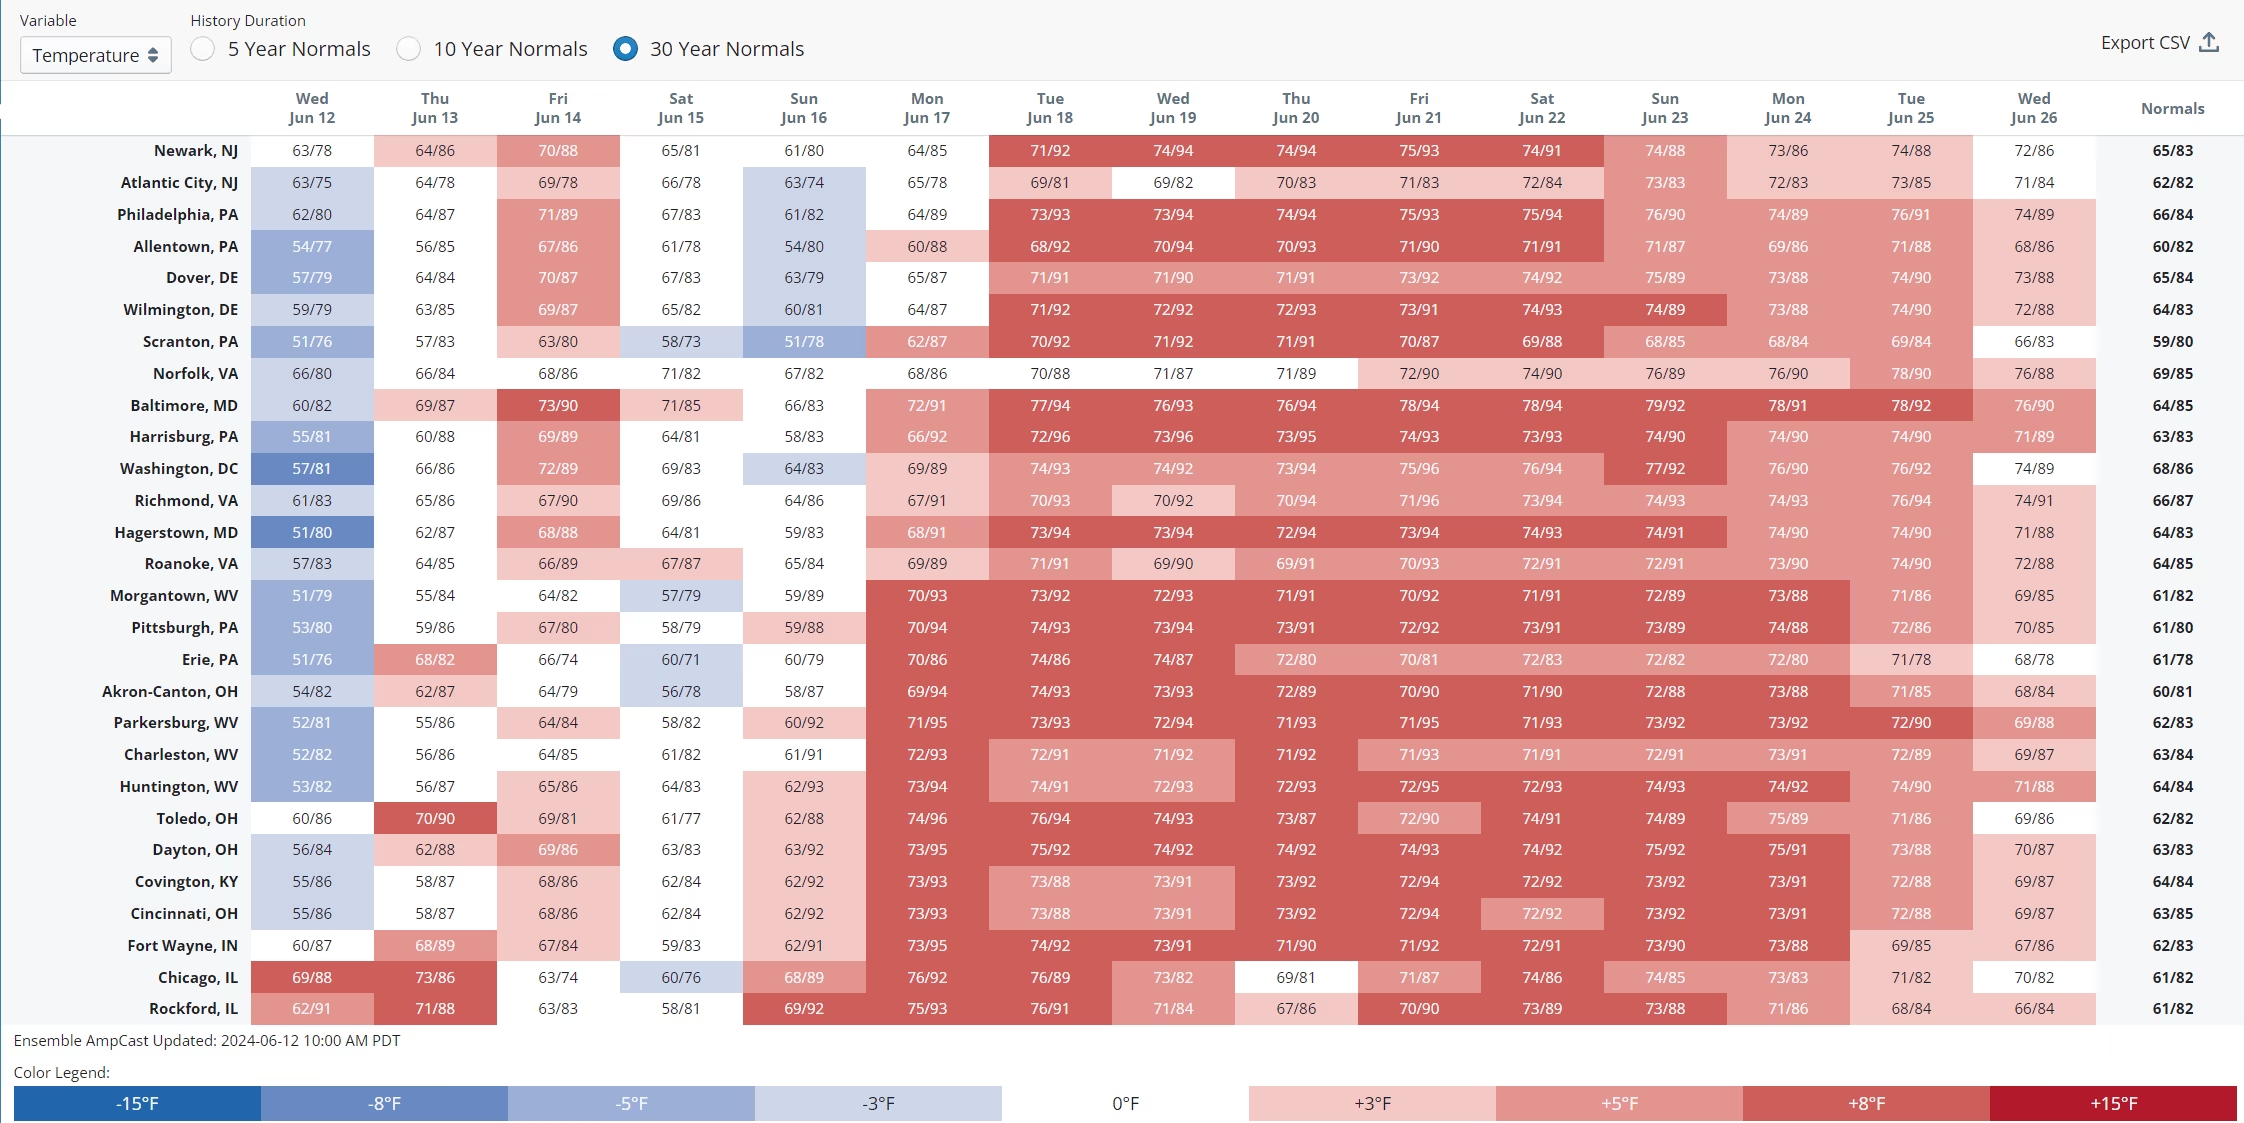
According to NASA, July 2023 is officially the hottest month globally since 1880. While the U.S. wasn’t as hot as other parts of the globe thanks to belows in the northcentral U.S., a heat wave at the end of the month caused some ISOs to issue warnings as they faced potential record high demand.
With extreme weather events on the rise, it’s important to have forecasts that take the intricacies of evolving climate patterns and shifting consumer behavior into consideration.
For July, Amperon continuously outperformed ISOs across the U.S. in accurately predicting demand during extreme heat events.
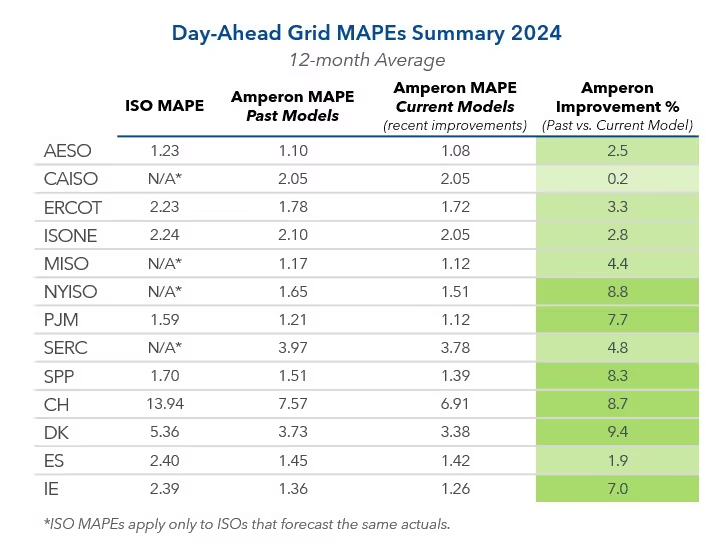
But before we get to the results, let's talk about the different kinds of MAPEs people use to measure accuracy. Amperon’s MAPE is calculated based on our day-ahead forecasts (including what we thought the weather was supposed to be) and not a weather-adjusted MAPE (which uses what the weather actually was). Since demand forecasts are so dependent on weather forecasts, Amperon’s MAPE shows the day-ahead forecasts to give our customers a more accurate picture of their positions.
ERCOT
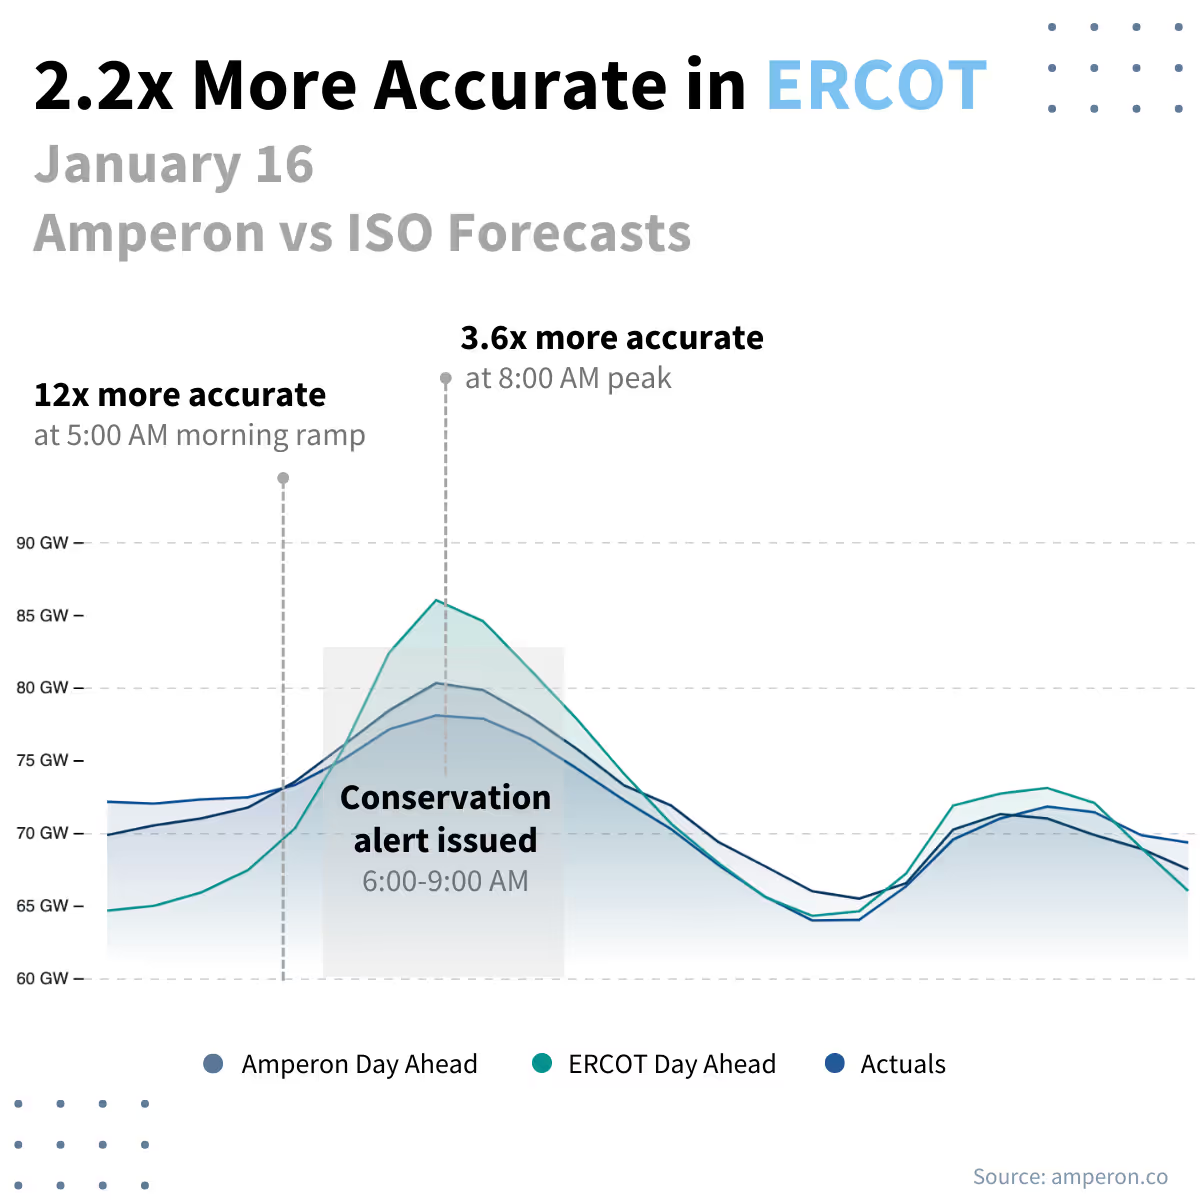
ERCOT historically is known to over forecast demand. While they need to skew on the safe side to avoid blackouts, this can make a huge difference for those that rely on accuracy.
ERCOT broke a new demand record on July 31 at 83 GW. This was after breaking records on July 18 (82.7 GW), July 17 (82 GW), July 13 (81.4 GW), and July 12 (81.4 GW). For the record-breaking July 31 at 5:00 PM, Amperon’s MAPE was 0.51% vs the ISO’s 1.40%.
For the month of July, Amperon’s MAPE was 1.53% vs the ISO’s 2.24%.

PJM
PJM hit peak load on July 27 at 6:00 PM. Amperon’s MAPE was 0.38% vs the ISO’s 4.15% – a whole 11x better during peak load.
For the whole month, Amperon’s MAPE was 1.64% vs the ISO’s 2.14%.

CAISO
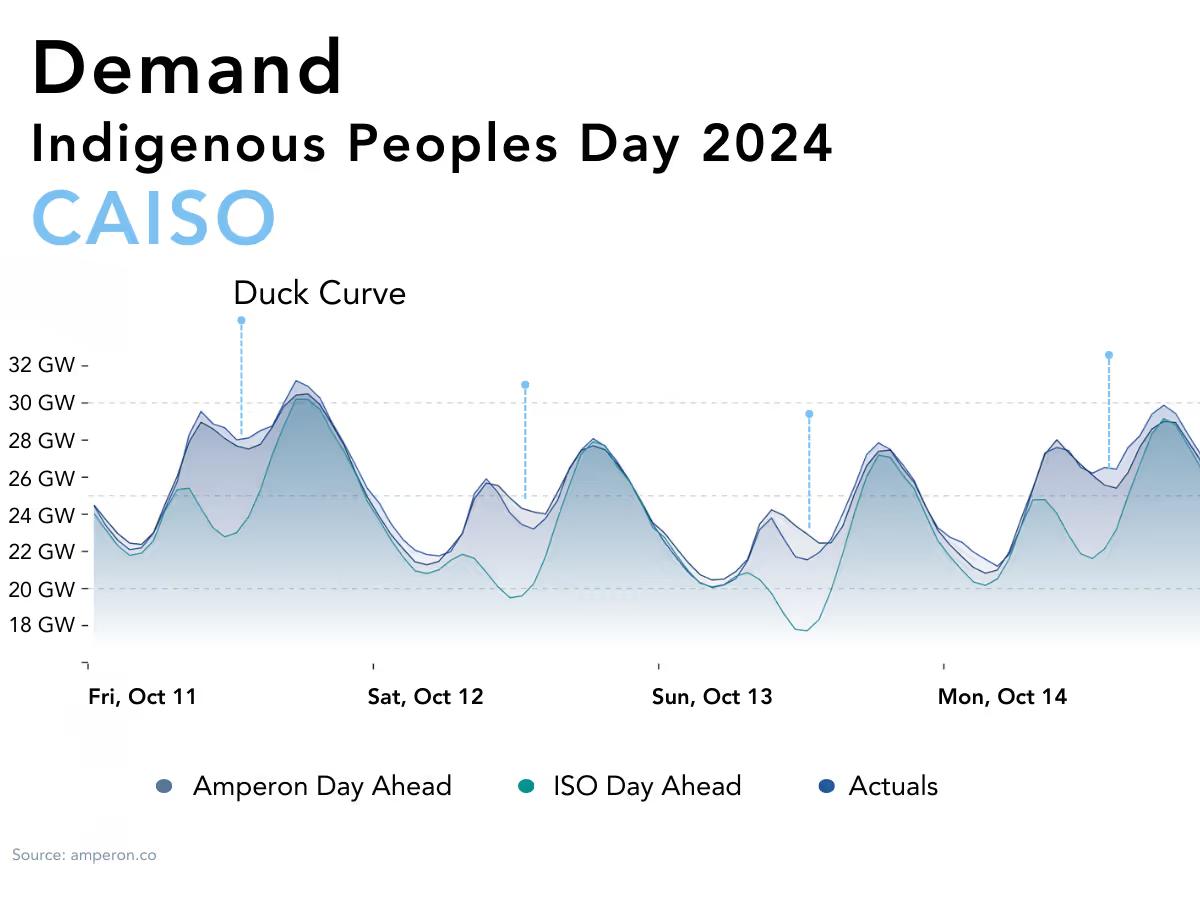
CAISO broke their record for solar generation twice that month on July 5th (15.91 GW) and 6th (15.95 GW). As more solar goes on line, it will be increasingly important for forecasting systems to understand the duck curve’s impact. On July 6th, Amperon’s MAPE was 1.18% vs the ISO’s 5.54%.
For July, Amperon’s MAPE was 2.26% vs the ISO’s 3.61%.


.svg)






%20(3).png)
%20(2).png)
%20(1).png)






.png)


.avif)




.avif)

.avif)

.avif)

.avif)
%20(15).avif)

.avif)
%20(10).avif)

.avif)

.avif)
.avif)





.avif)






.avif)

.avif)




.avif)



.avif)
.avif)


.avif)



.avif)
