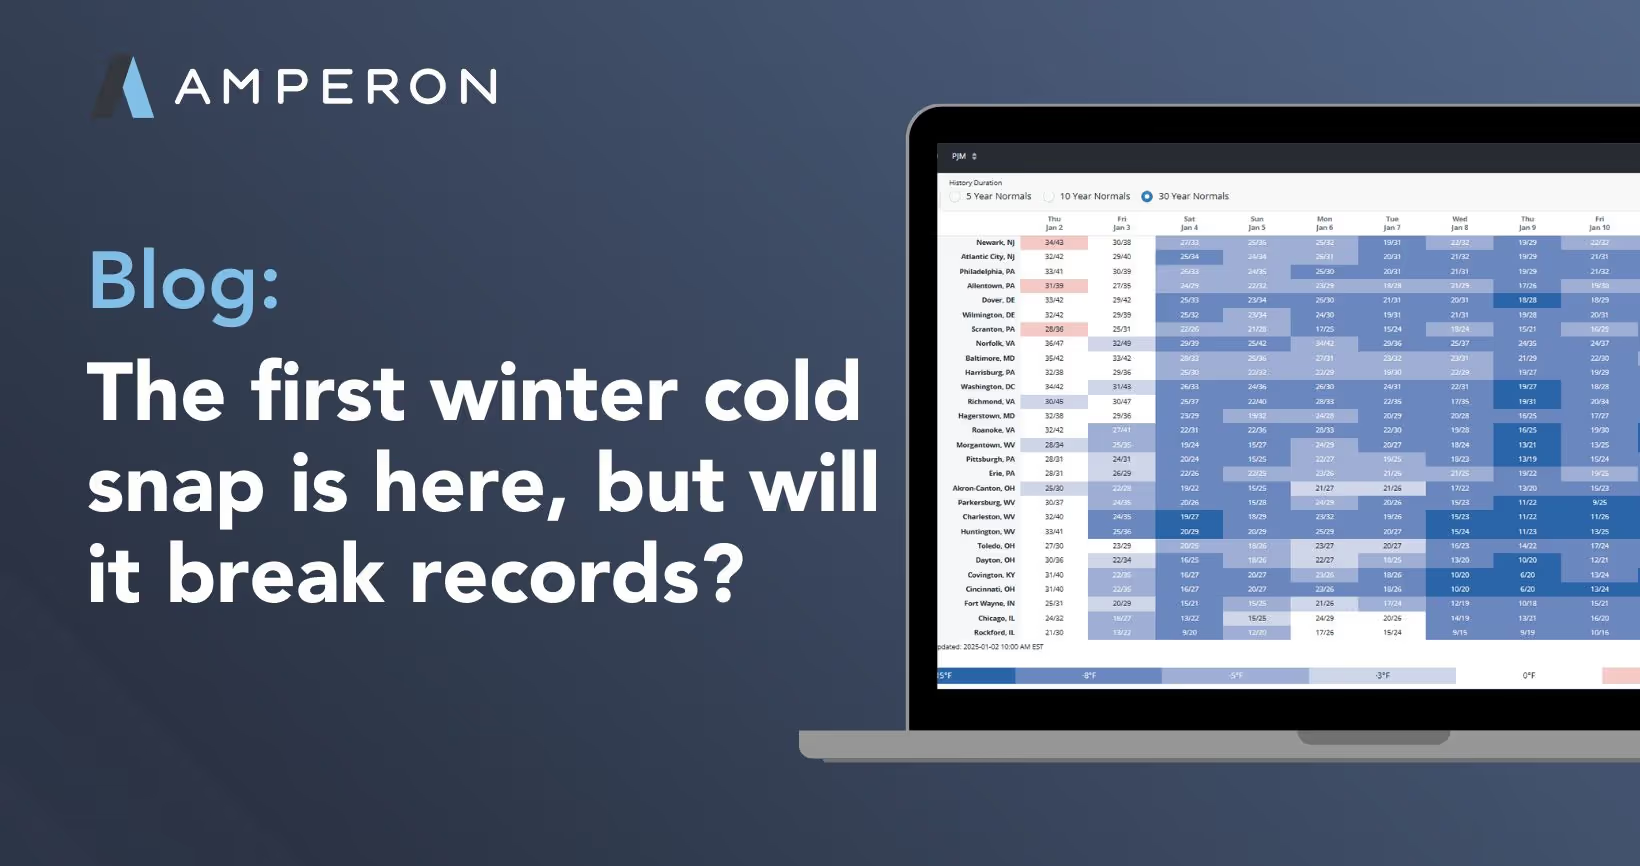
An Arctic blast hit most of the U.S. last week, bringing record cold weather during the coldest time of the year. While places like Chicago saw below-freezing temperatures, it was once again ERCOT that felt the most strain. After ERCOT was unable to add 3GW of capacity for winter reliability, this was the first test of the El Nino winter.
ERCOT
Heading into the storm, the morning of Tuesday, January 16th looked to be the riskiest time. With little solar generation during those early, cold hours and initial forecast showing very little wind, people were wondering if this would be a repeat of February 2021.
Historically, ERCOT over forecasts demand, which is understandable for a grid operator to be conservative. But since the end of December, their forecasts have ping ponged. ERCOT was predicting demand to hit 86 GW on January 16th, which was higher than the all-time demand record of 85 GW last summer and much higher than the 74 GW peak that happened during Winter Storm Elliott.
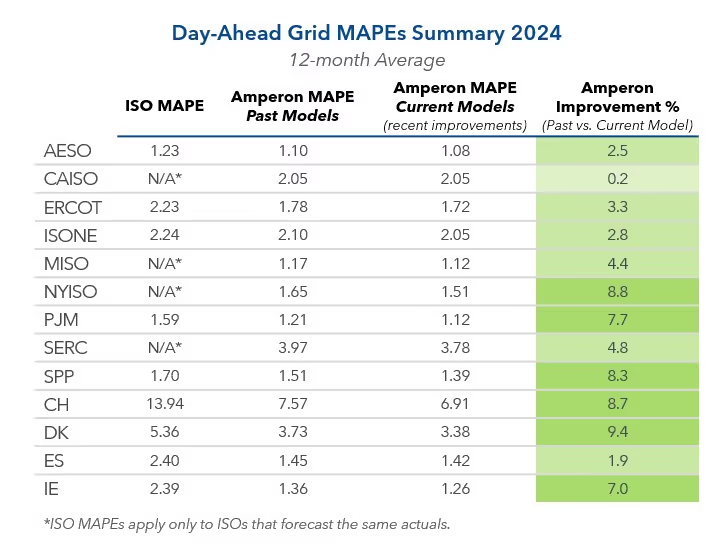
Actual demand came in much lower than that with peak demand reaching 78 GW at 8:00 am. Amperon’s forecasts nailed the morning ramp starting at 5:00 AM with a MAPE of 0.34% – 12x more accurate than ERCOT – at which point ERCOT issued a conservation request for 6:00-9:00 AM, encouraging business to shed load.
January 16 forecast recap:
- At peak hour, Amperon’s forecasts were 3.6x more accurate than ERCOT.
- For the full day, Amperon’s forecasts were 2.2x more accurate than ERCOT.

Tuesday wasn’t the only tricky day to forecast. This storm came in faster and colder than expected on Monday with all major weather models off by 7-10 degrees. Demand forecasting models are only as good as the weather data that feeds them. Bad weather data means bad results.
With the actual weather data from that day, Amperon’s forecasts had an accuracy score under 2%. Interestingly, ERCOT was very close to calling the 9:00 pm peak of 76.3 GW on Monday, predicting 75.6 GW. But, they actually forecasted 14 hours earlier at 7:00 am to be higher – with 82 GW of predicted demand – calling into question the integrity of their modeling approach.
Amperon Feature Highlight
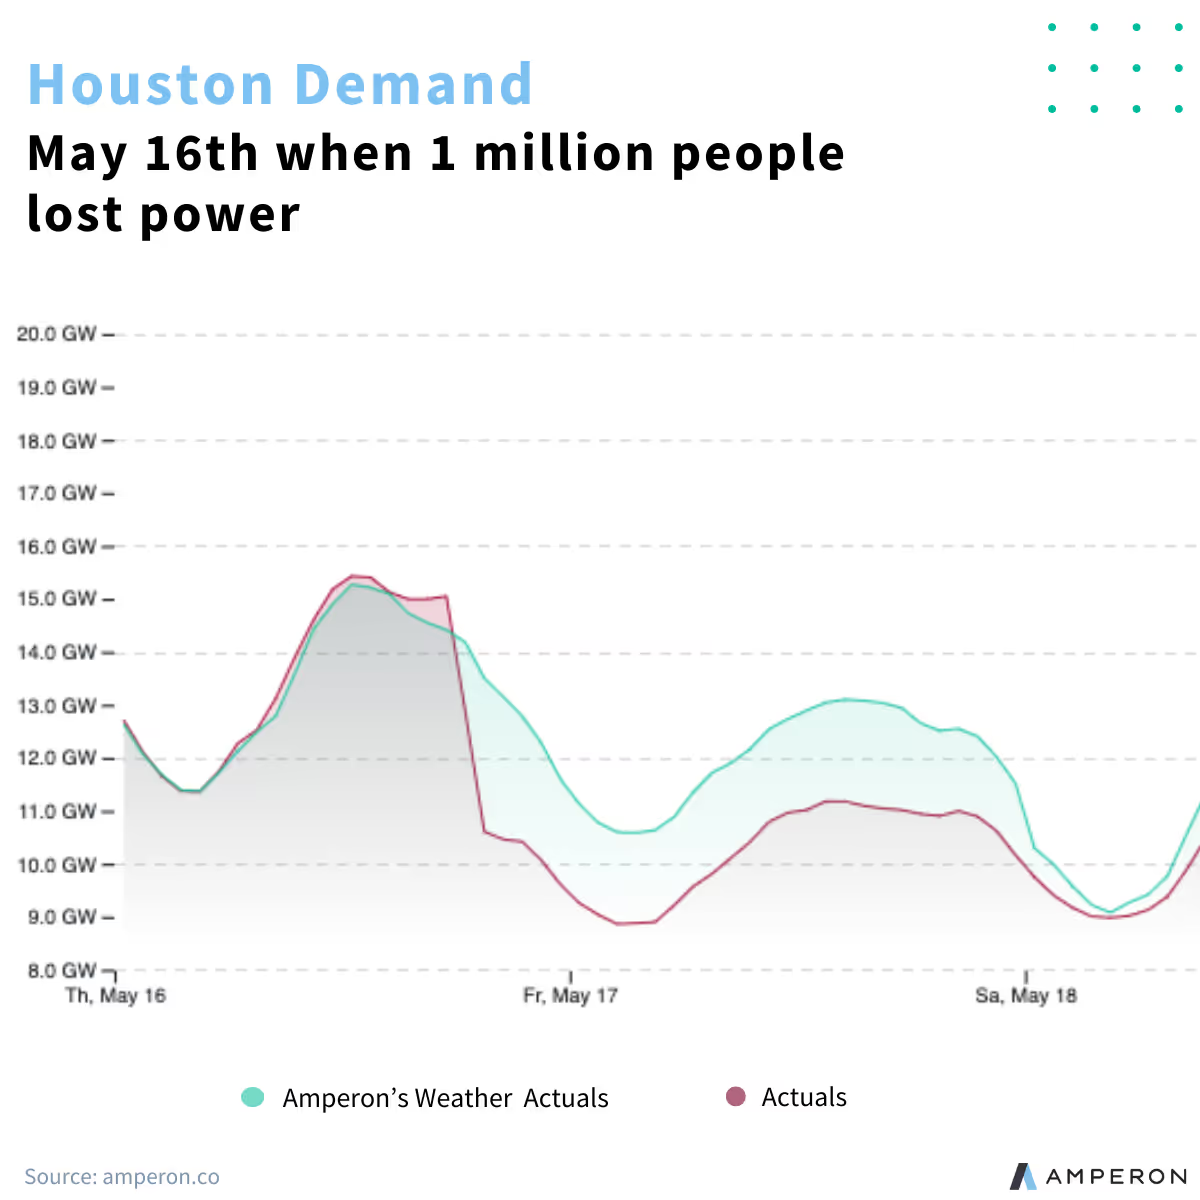
Weather Actual MAPE: It used to be time consuming to troubleshoot if a forecast miss was a weather issue or a modeling issue, but Amperon’s latest feature lets you compare Day-Ahead forecasts to Weather Actual forecasts. With one click on our grid-level forecasts, you can quickly see the Weather Actual MAPE and identify where the errors occurred. On January 15th, Amperon’s Weather Actual MAPE was 1.9% for the day and 0.92% for the peak.
Weather Scenarios: For those times weather misses occur, or when you have a hunch the temperatures will be colder or warmer than predicted, our Weather Scenarios feature lets you adjust temps by 1, 3, or 5 degrees to see how they impact demand. This gives you further control to manage risk.
Accurate Forecasts During the Peaks
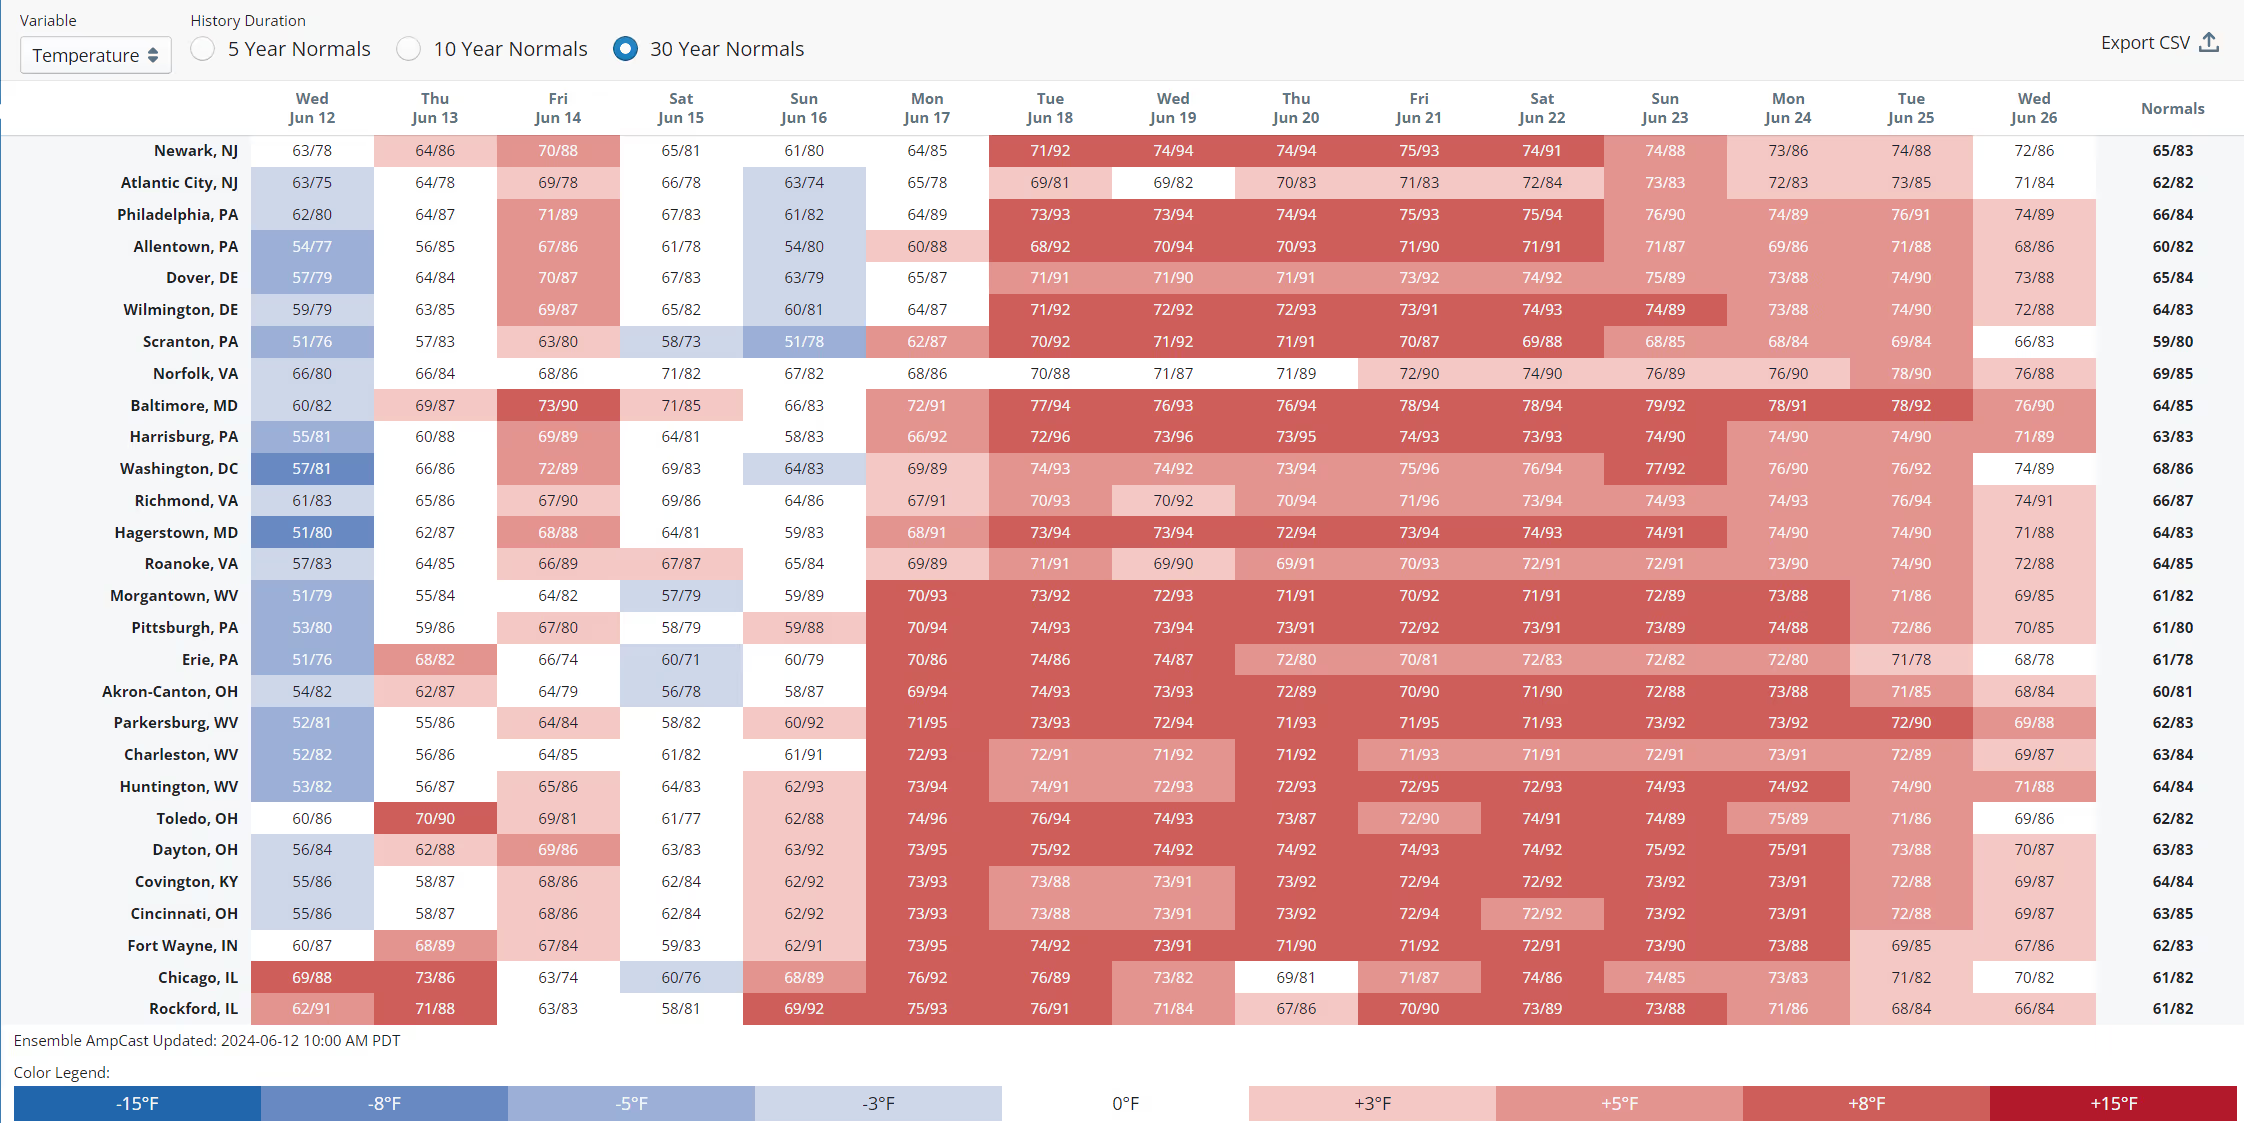
The storm brought cold from Texas all the way to the East Coast. Here is the peak demand for each region during the week of 1/14-1/20:
- PJM: Peak demand of 133.4 GW on Wednesday, January 17th at 8:00AM
- Amperon’s MAPE was under 2%
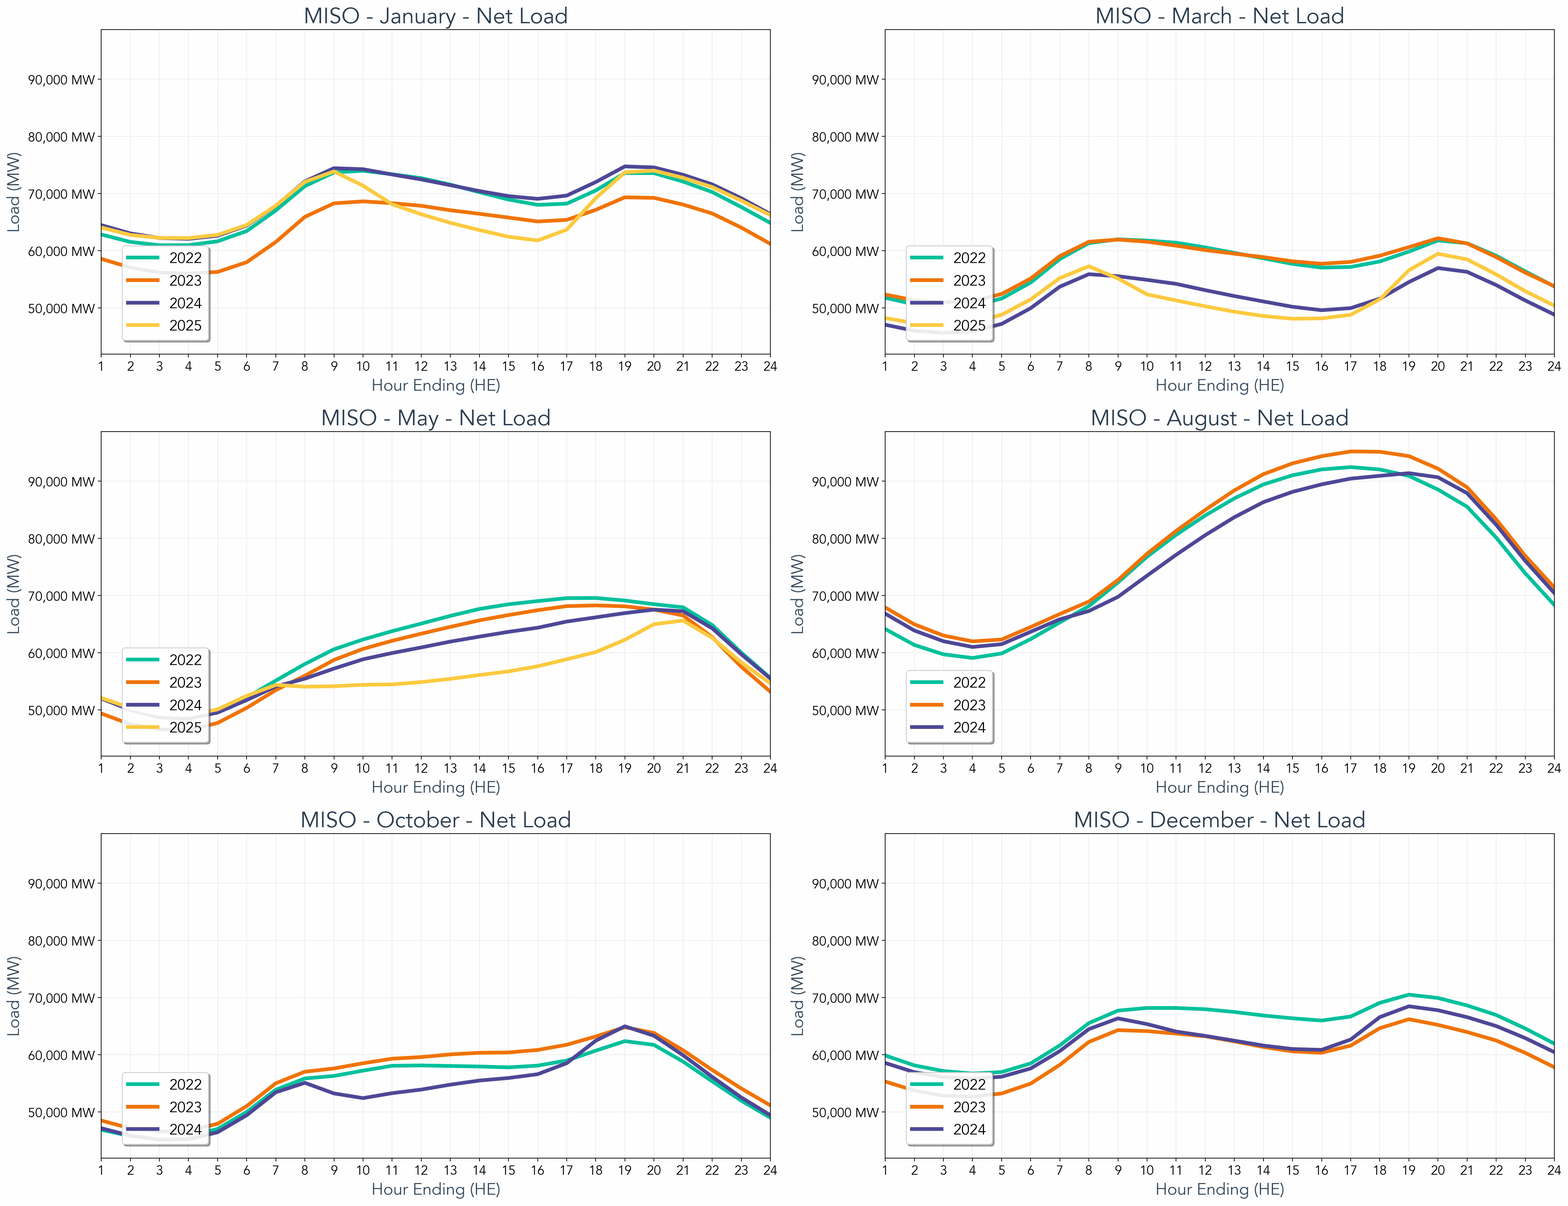
- MISO: Peak demand of 105.3 GW on Wednesday, January 17th at 9:00AM
- Amperon’s MAPE was 1.5% – 2x more accurate than the ISO
- NYISO: Peak demand of 22.8 GW on Wednesday, January 17th at 7:00PM
- Amperon’s MAPE was 0.24% – 18x more accurate than the ISO
From our Meteorologist
Weather misses have a huge impact on electricity forecast accuracy, which is why you need an experienced meteorologist who knows when the models aren’t cold enough.
Amperon’s chief meteorologist, Dr. Mark Shipham, started alerting our customers in early January that temperatures would be colder than forecasted, and that the Dallas Fort-Worth area was too high at the projected 22 degrees.
This recent storm was caused by weather blocking which disrupts the typical weather patterns, unleashing persistent and sometimes extreme weather conditions. Next month could see a similar blocking pattern like this severe cold front.
Prepared for the Extreme
Extreme weather events are becoming more and more common. That coupled with population growth and shifts in usage patterns has made forecasting demand even harder. February is typically Texas’ coldest month and there is a high likelihood another severe cold comes through.
Our data scientists consistently fine tune our models, incorporating new data from each extreme weather event. Following Winter Storm Elliott during Christmas 2022, our data scientists adjusted our models to account for more extreme cold (and hot) weather events. We’ve already seen the great results of those updates and are excited to see them continually get more and more accurate.


.svg)


%20(3).png)
%20(2).png)
%20(1).png)



.png)


.avif)



.avif)

.avif)

.avif)

.avif)
%20(15).avif)
.avif)
%20(10).avif)

.avif)

.avif)
.avif)






.avif)





.avif)

.avif)


.avif)



.avif)
.avif)


.avif)


